2026 MINERAL RESOURCE ESTIMATE AND MINERAL RESERVES

20 augusti, 10:07
20 augusti, 10:07
Canada NewsWire
PERTH, Australia, Aug. 20, 2026
Mineral Reserve ounces up 41%, grade up 15% - at a Reserve addition cost of $27/oz
PERTH, Australia , Aug. 20, 2026 /CNW/ -- Westgold Resources Limited (ASX: WGX) (TSX: WGX) (Westgold or the Company) is pleased to provide its updated Mineral Resource Estimate (MRE) and Mineral Reserve Statement, calculated as at 30 June 2026.
Group Gold Mineral Resource Estimate and
| As at 30 June 2026 |
Measured MRE | 30Mt at 2.36g/t Au for 2.3Moz |
Indicated MRE | 89Mt at 2.35g/t Au for 6.7Moz |
Measured & Indicated MRE | 119Mt at 2.35g/t Au for 9.0Moz |
Inferred MRE | 75Mt at 2.23g/t Au for 5.4Moz |
Proven Mineral Reserves | 15Mt at 1.90g/t Au for 0.9Moz |
Probable Mineral Reserves | 42Mt at 2.34g/t Au for 3.2Moz |
Proven and Probable Mineral Reserves | 57Mt at 2.22g/t Au for 4.1Moz |
* Westgold reports Mineral Resources inclusive of Mineral Reserves. Inferred Mineral Resources are reported separately from Measured and Indicated Mineral Resources and should not be interpreted as having the same level of confidence. |
Highlights
41% increase in Proven and Probable Mineral Reserve to 4.1Moz, post mining depletion and adjusting for non-core asset divestment – achieved at a modest reserve addition investment of just $27/oz.
15% increase in Proven and Probable Mineral Reserve grade to 2.22g/t (FY25: 1.93g/t) – marking the third consecutive year of Reserve growth after mining depletion.
Circa 10 year Reserve life maintained – approximately 10 years of Reserve inventory at current Group installed processing capacity.
26 drill rigs operating across portfolio – on surface and underground supporting resource growth and conversion activities.
$50–75M2 planned investment in FY27 exploration and resource development drilling – targeting both near-term Reserve growth opportunities and medium term organic growth options.
Westgold Managing Director and CEO Wayne Bramwell commented:
"Westgold's FY26 Mineral Resources and Mineral Reserves statement reflects the quality of the asset base and the breadth of our portfolio. Focused capital allocation into our largest mines continues to deliver material value, with FY26 marking a third consecutive year of Mineral Reserve growth.
Importantly, Group Mineral Resources increased after adjusting the prior-year comparative for the divestment of non-core assets 1 . This demonstrates the organic growth potential of our core assets within the streamlined portfolio.
But we did not just grow our inventory in FY26; we improved its quality, with both Resource and Reserve grades increasing year-on-year while lifting Resource confidence across the portfolio by increasing the proportion of the Measured and Indicated Resource category. Importantly, this growth was generated organically at a cost of circa $27/oz and resulted in more than 1.5Moz of gross Mineral Reserve additions.
With $50–75M 2 planned for exploration and resource development in FY27 and 26 drill rigs active across the Murchison and Southern Goldfields, Westgold is investing to convert more of its large Resource base into higher-confidence Reserves, extend mine life and strengthen future production options. This disciplined organic growth strategy is designed to build on FY26 momentum and create enduring value for shareholders."
2026 Mineral Resource Estimate
As at 30 June 2026, the gold Measured and Indicated Mineral Resource Estimate for the Westgold business was 119Mt at 2.35g/t Au for 9.0Moz and the Inferred Mineral Resource estimate was 75Mt at 2.23g/t Au for 5.4Moz .
This represents considerable growth in the Company's gold Mineral Resource base year-on-year, after adjusting for divestment of the non-core assets of Peak Hill, Reedy's, Comet, Chalice and Mount Henry 1 .
This growth highlights the ongoing exploration and resource development potential of Westgold's Western Australian landholdings.
Tables 1, 2 and 3 below present the FY26 Mineral Resource Estimates for the Murchison and Southern Goldfields operations.
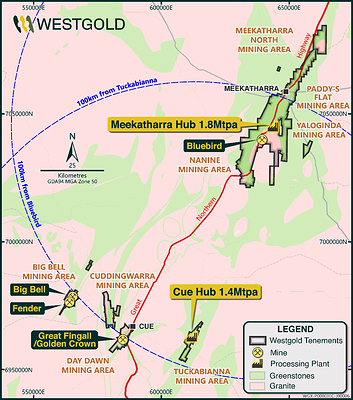
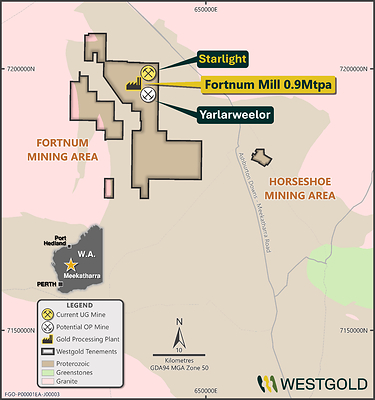
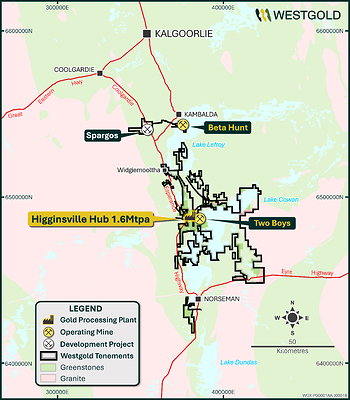
Figures 1, 2 and 3 below map Westgold's portfolio which spans 2,500km 2 .
_________________________________ |
1 Refer to the Company's ASX announcements titled "Completion of the Mt Henry-Selene Gold Project Divestment" dated 16 February 2026, "Westgold Completes Demerger of Non-Core Assets to Valiant" dated 13 March 2026, "Completion of the Chalice Gold Project Divestment" dated 9 July 2026 and "Completion of the Peak Hill Gold Project Divestment" dated 1 July 2026 for further information regarding the non-core asset divestments. |
2 This reflects the current intentions of the Company and is subject to operational priorities, market conditions and Board approval. Accordingly, this planned investment may be subject to change. |
Table 1 – Gold Mineral Resource Estimates as at 30 June 2026 for Westgold operating mines
Murchison Gold Operations | ||||||||||||
Mineral Resource Statement – rounded for reporting | ||||||||||||
As at 30 June 2026 | ||||||||||||
Measured | Indicated | Measured and Indicated | Inferred | |||||||||
Operating mine | Tonnes
| Grade | Ounces
| Tonnes
| Grade | Ounces
| Tonnes
| Grade | Ounces
| Tonnes
| Grade | Ounces
|
Big Bell UG | 7,504 | 2.17 | 523 | 8,684 | 3.10 | 865 | 16,188 | 2.67 | 1,388 | 9,001 | 2.94 | 851 |
Fender UG | 100 | 2.78 | 9 | 139 | 2.57 | 11 | 239 | 2.66 | 20 | 112 | 2.79 | 10 |
Great Fingall UG | 63 | 3.59 | 7 | 2,301 | 4.14 | 306 | 2,363 | 4.13 | 313 | 1,113 | 2.78 | 99 |
Golden Crown UG | 0 | 0.00 | 0 | 471 | 5.87 | 89 | 471 | 5.87 | 89 | 2,100 | 3.08 | 208 |
Bluebird Group UG | 1,292 | 3.11 | 129 | 8,203 | 2.93 | 773 | 9,495 | 2.95 | 902 | 6,489 | 2.53 | 528 |
Starlight UG | 4,991 | 3.01 | 483 | 2,636 | 2.26 | 192 | 7,628 | 2.75 | 675 | 4,353 | 2.08 | 291 |
Total | 13,950 | 2.57 | 1,151 | 22,434 | 3.10 | 2,236 | 36,384 | 2.90 | 3,388 | 23,168 | 2.67 | 1,987 |
Southern Goldfields Gold Operations | ||||||||||||
Mineral Resource Statement – rounded for reporting | ||||||||||||
As at 30 June 2026 | ||||||||||||
Measured | Indicated | Measured and Indicated | Inferred | |||||||||
Operating mine | Tonnes ('000s) | Grade | Ounces Au ('000s) | Tonnes ('000s) | Grade | Ounces Au ('000s) | Tonnes ('000s) | Grade | Ounces Au ('000s) | Tonnes ('000s) | Grade | Ounces Au ('000s) |
Two Boys | 84 | 5.31 | 14 | 212 | 3.25 | 22 | 296 | 3.84 | 37 | 75 | 3.03 | 7 |
Lake Cowan | 40 | 1.57 | 2 | 104 | 1.21 | 4 | 144 | 1.31 | 6 | 19 | 1.27 | 1 |
Beta Hunt | 10,682 | 2.21 | 759 | 31,531 | 2.43 | 2,463 | 42,212 | 2.37 | 3,222 | 32,392 | 2.08 | 2,170 |
Total | 10,806 | 2.23 | 775 | 31,847 | 2.43 | 2,489 | 42,652 | 2.38 | 3,265 | 32,487 | 2.09 | 2,178 |
Table 2 – Gold Mineral Resource Estimates as at 30 June 2026 for Westgold non-operating projects
Non-operating Murchison projects | ||||||||||||
Mineral Resource Statement – rounded for reporting | ||||||||||||
As at 30 June 2026 | ||||||||||||
Measured | Indicated | Measured and Indicated | Inferred | |||||||||
Project | Tonnes ('000s) | Grade | Ounces Au ('000s) | Tonnes ('000s) | Grade | Ounces Au ('000s) | Tonnes ('000s) | Grade | Ounces Au ('000s) | Tonnes ('000s) | Grade | Ounces Au ('000s) |
Big Bell District | 157 | 2.65 | 13 | 664 | 2.55 | 54 | 821 | 2.57 | 68 | 1,828 | 2.95 | 174 |
Cuddingwarra | 194 | 1.66 | 10 | 1,689 | 1.58 | 86 | 1,882 | 1.59 | 96 | 542 | 1.49 | 26 |
Day Dawn District | 78 | 1.65 | 4 | 1,101 | 1.98 | 70 | 1,179 | 1.96 | 74 | 1,040 | 1.82 | 61 |
Tuckabianna | 58 | 1.83 | 3 | 1,619 | 2.59 | 135 | 1,677 | 2.57 | 139 | 1,631 | 2.65 | 139 |
Tuckabianna Stockpiles | 87 | 2.16 | 6 | 3,760 | 0.70 | 85 | 3,847 | 0.73 | 91 | 0 | 0.00 | 0 |
Meekatharra North | 0 | 0.00 | 0 | 97 | 1.98 | 6 | 97 | 1.98 | 6 | 75 | 2.11 | 5 |
Nannine | 74 | 2.42 | 6 | 1,120 | 1.85 | 67 | 1,194 | 1.88 | 72 | 355 | 2.22 | 25 |
Paddy's Flat | 376 | 3.67 | 44 | 7,125 | 1.88 | 431 | 7,501 | 1.97 | 475 | 2,401 | 2.00 | 154 |
Yaloginda District | 54 | 2.69 | 5 | 4,300 | 1.47 | 204 | 4,354 | 1.49 | 208 | 5,842 | 1.38 | 259 |
Bluebird Stockpiles | 137 | 2.89 | 13 | 29 | 0.91 | 1 | 167 | 2.54 | 14 | 0 | 0.00 | 0 |
Fortnum District | 1,370 | 2.35 | 104 | 5,992 | 1.65 | 319 | 7,362 | 1.78 | 422 | 1,831 | 1.33 | 78 |
Horseshoe | 0 | 0.00 | 0 | 1,720 | 1.91 | 106 | 1,720 | 1.91 | 106 | 385 | 1.66 | 21 |
FGO Stockpiles | 290 | 1.28 | 12 | 390 | 0.67 | 8 | 680 | 0.93 | 20 | 15 | 0.54 | 0 |
Total | 2,876 | 2.38 | 220 | 29,607 | 1.65 | 1,571 | 32,483 | 1.72 | 1,791 | 15,945 | 1.84 | 942 |
Non-operating Southern Goldfields projects | ||||||||||||
Mineral Resource Statement - Rounded for Reporting | ||||||||||||
As at 30 June 2026 | ||||||||||||
Measured | Indicated | Measured and Indicated | Inferred | |||||||||
Project | Tonnes ('000s) | Grade | Ounces Au ('000s) | Tonnes ('000s) | Grade | Ounces Au ('000s) | Tonnes ('000s) | Grade | Ounces Au ('000s) | Tonnes ('000s) | Grade | Ounces Au ('000s) |
HGO Central | 931 | 2.94 | 88 | 2,991 | 2.58 | 248 | 3,922 | 2.67 | 336 | 1,642 | 2.81 | 148 |
HGO Greater | 8 | 1.73 | 0 | 1,893 | 2.82 | 172 | 1,901 | 2.82 | 172 | 1,568 | 2.12 | 107 |
HGO Stockpiles | 1,391 | 0.79 | 35 | 275 | 0.74 | 6 | 1,665 | 0.78 | 42 | 0 | 0.00 | 0 |
BHO Stockpiles | 0 | 0.00 | 0 | 0 | 0.00 | 0 | 0 | 0 | 0 | 0 | 0.00 | 0 |
Total | 2,330 | 1.65 | 124 | 5,158 | 2.57 | 426 | 7,488 | 2.28 | 550 | 3,210 | 2.47 | 255 |
Table 3 – Nickel Mineral Resource Estimates at 30 June 2026 for Beta Hunt
Beta Hunt Nickel Operations | ||||||||||||
Mineral Resource Statement - Rounded for Reporting | ||||||||||||
As at 30 June 2026 | ||||||||||||
Measured | Indicated | Measured and Indicated | Inferred | |||||||||
Project | Tonnes ('000s) | Ni (%) | NiT | Tonnes ('000s) | Ni (%) | NiT ('000s) | Tonnes ('000s) | Ni (%) | NiT | Tonnes ('000s) | Ni (%) | NiT |
Beta Hunt | 0 | 0.0 | 0 | 749 | 2.8 | 21 | 749 | 2.8 | 21 | 499 | 2.7 | 13 |
Total | 0 | 0.0 % | 0 | 749 | 2.8 % | 21 | 749 | 2.8 % | 21 | 499 | 2.7 % | 13 |
Additional detailed information relating to generation of the Mineral Resource Estimates is attached in Appendix A & B Table 1 – JORC 2012 Reporting Criteria.
Geology
Murchison
The Meekatharra Gold Operation is located in the Archaean Murchison Province, a granite-greenstone terrane in the north-western Yilgarn Craton. North-northeast-trending greenstone belts are separated by granite-gneiss domes, with smaller granite plutons also present within, or on the margins of, the belts.
The Paddy's Flat area is located on the western limb of a regional fold, the Polelle Syncline, within a sequence of mafic to ultramafic volcanic rocks with minor interflow sediments and banded iron-formation. The sequence was intruded by felsic porphyry dykes prior to mineralisation.
Mineralisation at Paddy's Flat occurs along four sub-parallel trends and comprises sulphide-replacement BIF-hosted gold, quartz-vein-hosted shear-related gold, and quartz-carbonate-sulphide stockwork vein- and alteration-related gold.
The Yaloginda area, which hosts Bluebird–South Junction, is a gold-bearing Archaean greenstone belt situated approximately 15km south of Meekatharra. The deposits in the area are hosted within a strained and metamorphosed volcanic sequence consisting primarily of ultramafic rocks and high-magnesium basalt, with minor komatiite, peridotite, gabbro, tholeiitic basalt and interflow sediments.
The sequence was intruded by a variety of felsic porphyry and intermediate sills and dykes.
The Cue Gold Operations are located in the Archaean Murchison Province, a granite-greenstone terrane in the north-western Yilgarn Craton. North-northeast-trending greenstone belts are separated by granite-gneiss domes, with smaller granite plutons also present within, or on the margins of, the belts.
Mineralisation at Big Bell is hosted within the shear zone, known as the Big Bell Mine Sequence, and is associated with post-peak metamorphic retrograde assemblages. Stibnite, native antimony and trace arsenopyrite are disseminated through the K-feldspar-rich lode schist. These minerals are intergrown with pyrite, pyrrhotite and chalcopyrite. Mineralisation outside the typical Big Bell host rocks (KPSH), including 1,600N and Shocker, also displays a very strong W-As-Sb geochemical halo.
Numerous gold deposits occur within the Cuddingwarra Project area, the majority of which are hosted within the central mafic-ultramafic ± felsic porphyry sequence. Within this broad framework, mineralisation is interpreted to be spatially controlled by competency contrasts across, and flexures along, layer-parallel D2 shear zones, and is maximised where transected by corridors of northeast-striking D3 faults and fractures.
The Great Fingall Dolerite hosts the majority of gold mineralisation within the portion of the greenstone belt proximal to Cue, known as the Day Dawn Project Area. Unit AGF3 is the most brittle of the five units, and this characteristic is responsible for its role as the most favourable lithological host for gold mineralisation in the greenstone belt.
The Fortnum deposits are Palaeoproterozoic shear-hosted gold deposits within the Fortnum Wedge, a localised thrust duplex of the Narracoota Formation within the overlying Ravelstone Formation. Both stratigraphic formations form part of the Bryah Basin in the Capricorn Orogen, Western Australia.
The Horseshoe Cassidy deposits are hosted within the Ravelstone Formation, comprising siltstone and argillite, and the Narracoota Formation, comprising highly altered, moderately to strongly deformed mafic to ultramafic rocks. The main zone of mineralisation is developed within a horizon of highly altered magnesian basalt.
Gold mineralisation is associated with strong vein stockworks confined to the altered mafic unit. Alteration comprises proximal silica-carbonate-fuchsite-haematite-pyrite stockwork and distal silica-haematite-carbonate ± chlorite assemblages.
Southern Goldfields
The Beta Hunt Gold Operations are situated within the central portion of the Norseman-Wiluna greenstone belt, in a sequence of mafic, ultramafic and felsic rocks on the south-western flank of the Kambalda Dome. Gold mineralisation occurs mainly in sub-vertical shear zones within the Lunnon Basalt and is characterised by shear-hosted and extensional quartz veining within a halo of biotite-pyrite alteration.
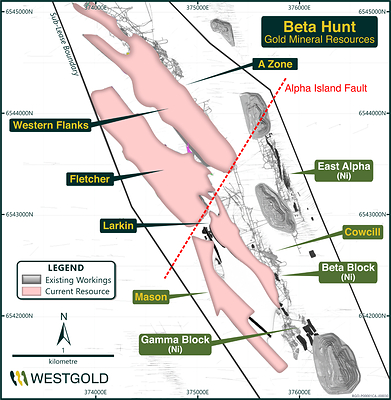
Within these shear zones, coarse gold locally occurs where the shear zones intersect iron-rich sulphidic metasediments in the Lunnon Basalt, or nickel sulphides at the base of the Kambalda Komatiite (ultramafic rocks). The mineralised shears are represented by the A Zone, Western Flanks, Fletcher, Larkin and Mason zones.
The Higginsville Gold Operation is located in the Eastern Goldfields Superterrane of the Archaean Yilgarn Craton. The majority of the Higginsville tenement package is located within the well-mineralised Kalgoorlie Terrane, between the gold-mining centres of Norseman and St Ives. HGO can be subdivided into five major geological domains: Trident Line of Lode, Lake Cowan, Southern Palaeochannels, Polar Bear Group and Spargo's Project area.
The majority of mineralisation along the Trident Line of Lode is hosted within the Poseidon Gabbro and high-MgO dyke complexes to the south. The Poseidon Gabbro is a thick, weakly differentiated gabbroic sill that strikes north-south, dips 60° to the east, is more than 500 m thick and is 2.5km long. Mineralisation is hosted within, or marginal to, quartz veining and is structurally and lithologically controlled.
The Lake Cowan project area is situated near the centre of a regional anticline between the Zuleika and Lefroy shears. The local geology is made more complex by the intrusion of the massive Proterozoic Binneringie Dyke. The majority of mineralisation at the Lake Cowan Mining Centre is hosted within an enclave of Archaean material surrounded by the Binneringie Dyke.
Mineralised zones within the Southern Palaeochannels network comprise both placer gold, typically near the base of the channel-fill sequences, and chemically precipitated secondary gold within the channel-fill materials and underlying saprolite. These gold concentrations commonly overlie, or are adjacent to, primary mineralised zones within Archaean bedrock.
The Polar Bear project is situated within the Archaean Norseman-Wiluna Belt, which locally includes basalts, komatiites, metasediments and felsic volcaniclastics. Primary gold mineralisation is related to hydrothermal activity during multiple deformation events. Available indications suggest that gold mineralisation is focused on, or near, the stratigraphic boundary between the Killaloe and Buldania formations.
The Spargo's Project occurs within the Coolgardie Domain of the Kalgoorlie Terrane. The area is bounded by the Zuleika Shear to the east and the Kunanalling Shear to the west. The geological setting comprises tightly folded, north-south-striking ultramafic and mafic volcanic rocks at the northern closure of the Widgiemooltha Dome.
The project lies on the general trend of the Kunanalling-Karramindie Shear corridor, a regional shear zone that hosts significant mineralisation to the north at Ghost Crab (Mount Marion), Wattle Dam to the south, the Penfolds Group and Kunanalling. The regionally prospective Zuleika Shear lies to the east of the project. The tenements are prospective for vein- and shear-hosted gold deposits, as demonstrated by Spargo's Reward and numerous other gold workings and occurrences.
Gold mineralisation at Spargo's Reward is hosted by a coarse-grained pyrite-arsenopyrite lode within quartz-sericite schists, between strongly biotite-altered greywacke to the east and quartz-sericite-fuchsite-pyrite-altered felsic tuff to the west. Gold mineralisation is associated with very little quartz veining, which is atypical for many deposits in the region. The Spargo's Reward setting has been described variously as a low-quartz sulphidic mesothermal gold system or as a Hemlo-style syn-sedimentary occurrence.
Background to the Mineral Resource Estimate
Geological interpretation of individual deposits is carried out using a systematic approach to ensure that the resulting Mineral Resource Estimates are both sufficiently constrained and representative of the expected subsurface conditions. In all aspects of Mineral Resource Estimation, factual and interpreted geology is used to guide the development of the interpretation. Geological matrices are established to assist with the interpretation and construction of estimation domains.
A significant portion of the data used in Mineral Resource Estimates has been gathered from diamond core, with multiple core sizes used. The core is geologically logged and subsequently halved for sampling. Grade control holes may be whole-cored to streamline the core-handling process, if required. Face sampling data is also used, with each development face or round chip sampled. Sampling intervals are domained by geological constraints, such as rock type, veining, alteration and sulphidation.
All geological input is logged and validated by the relevant area geologists, including an assessment of sample recovery. No defined relationship exists between sample recovery and grade, and no sample bias due to preferential loss or gain of fine or coarse material has been noted at any deposit.
Faces are nominally chip sampled horizontally across the face from left to right, or vertically from top to bottom, and sub-set according to geological features as appropriate. Diamond drilling is half-core niche sampled, or whole-cored where appropriate, and sub-set according to geological features as appropriate.
Samples undergo fine pulverisation of the entire sample using an LM5-type mill to achieve a 75µm product prior to splitting. QA/QC is maintained during the sub-sampling process through the systems of an independent NATA/ISO-accredited laboratory contractor. The sample size is considered appropriate for the grain size of the material being sampled. The unsampled half of diamond core is retained for check sampling, if required.
Samples are analysed for gold by fire assay, whereby a 40g to 50g sample undergoes fire assay lead collection followed by flame atomic absorption spectrometry. Quality control is maintained through the use of standards, blanks and duplicates. The laboratory includes a minimum of one project standard with every 22 samples analysed. No significant QA/QC issues have arisen in recent drilling results.
PhotonAssay™ was introduced in 2023 for Beta Hunt gold grade control samples. PhotonAssay™ technology, developed by Chrysos Corporation Limited, is a rapid, non-destructive method for analysing gold and other elements in mineral samples. It is based on the principle of gamma activation, which uses high-energy X-rays to excite changes in the nuclear structure of selected elements. The decay is then measured to provide a gold analysis. Each sample is run through two cycles, with a radiation time of 15 seconds. This methodology is insensitive to material type and therefore does not require fluxing chemicals, unlike fire assay. This technique was discontinued in 2024.
Nickel analyses have been completed by four-acid digest, with final analysis using ICP-OES.
After validating the drillhole data to be used in the estimate, interpretation of the orebody is undertaken to create the intervals that form the basis of the three-dimensional orebody wireframe. Wireframing is then carried out using a combination of automated modelling algorithms and manual triangulation to create an accurate three-dimensional representation of the subsurface mineralised body.
Drillhole intersections within the mineralised body are then used to flag the appropriate sections of the drillhole database tables for compositing purposes. Drillholes are subsequently composited to allow grade estimation. In all aspects of resource estimation, factual and interpreted geology is used to guide the development of the interpretation.
Once the sample data has been composited, statistical analysis is undertaken to assist in determining estimation search parameters and top-cuts. Analysis of individual domains is undertaken to determine appropriate search parameters, which are then incorporated with observed geological and geometrical features to determine the most appropriate estimation approach.
An empty block model is then created for the area of interest. This model contains attributes set at background values for the various elements of interest, as well as density and estimation parameters that are subsequently used to assist with resource categorisation. The block sizes used in the model vary depending on orebody geometry, minimum mining units, estimation parameters and the level of informing data available.
Grade estimation is then undertaken. Ordinary Kriging is considered the standard estimation method, although Categorical Indicator Kriging is used in some instances. Estimation results are validated against primary input data, previous estimates and mining output.
The Mineral Resource is then depleted for mining voids and classified in accordance with the JORC Code, using a combination of estimation-derived parameters and geological and mining knowledge.
Data spacing varies depending on the individual lode under consideration.
This approach considers all relevant factors and reflects the Competent Person's view of the deposit.
The cut-off grades used for reporting Mineral Resource Estimates are selected based on the style of mineralisation, depth below surface, most probable extraction technique and associated costs.
Likely mining approaches have been considered during domaining, estimation and classification. However, no mining dilution or ore loss has been modelled in the resource model or applied to the reported Mineral Resource Estimate. Metallurgical recovery has also not been applied to the reported Mineral Resource Estimate.
These factors are applied during the Mineral Reserve generation process.
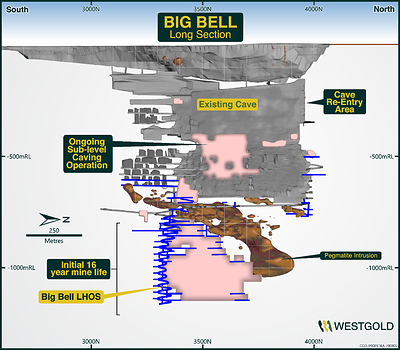
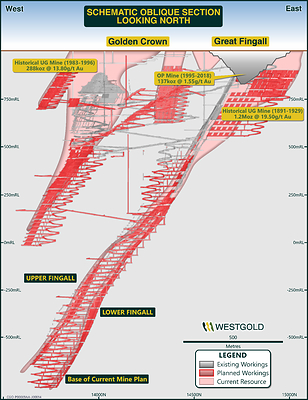
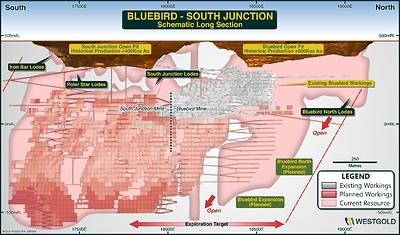
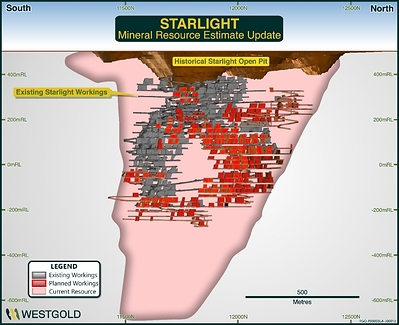
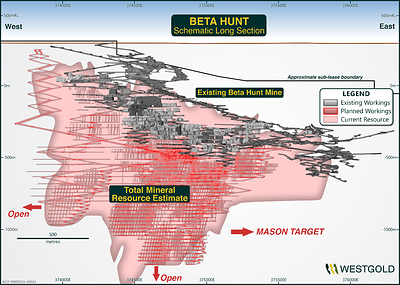
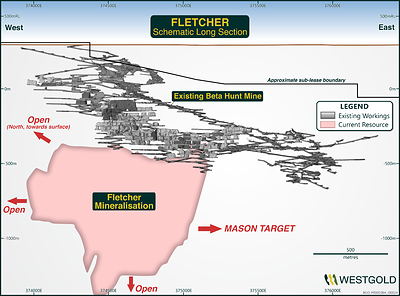
Figures 4-10 depict the Resource Schematics for Westgold's key operating mines and growth projects.
Westgold nickel Mineral Resources have remained static year-on-year.
2026 Mineral Reserves
Figure 11 depicts Westgold's Proven and Probable Mineral Reserves and cumulative depletion since 2017. As at 30 June 2026, Proven and Probable Mineral Reserves were 57Mt at 2.22 g/t Au for 4.1Moz of gold .
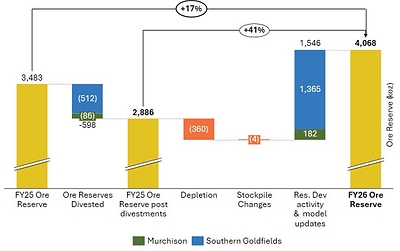
This represents 41% growth in Westgold's gold Proven and Probable Mineral Reserves since FY25 after adjusting for divestment of non-core assets 1 (see Figure 12 ). Importantly, average Mineral Reserve grade increased 15% from 1.93g/t to 2.22g/t, demonstrating that growth was not achieved through the addition of lower-quality ounces, but through the successful conversion of higher-confidence and higher-grade Mineral Resources. This marks the third consecutive year of Mineral Reserve growth after mining depletion, underpinned by the maiden Fletcher Mineral Reserve 3 at Beta Hunt and continued investment in exploration and resource drilling.
FY26 drilling delivered approximately 1.5Moz of gross Mineral Reserve additions from exploration and resource development expenditure of approximately $42M, resulting in an Mineral Reserve conversion cost of an outstanding $27/oz 4 — a highly competitive outcome compared to the cost of acquiring Reserve ounces inorganically.
In FY27, Westgold expects to spend $50 – 75M 2 on exploration and resource definition drilling, with a focus on converting Mineral Resources to Mineral Reserves and providing further organic growth opportunities for the business.
____________________________________ |
3 Refer to the Company's ASX announcement titled "1.1Moz Maiden Fletcher Ore Reserve" dated 18 August 2026 for further information. |
4 Calculated as $42M divided by 1.5Moz of gross Ore Reserve (excludes divestments, depletion and stockpile movements). |
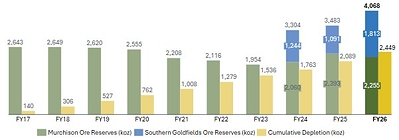
Table 4 and 5 below depicts the FY26 Mineral Reserves statement for the Murchison and Southern Goldfields.
Table 4 – Gold Mineral Reserves at 30 June 2026 for Westgold Operating Mines
Murchison Gold Operations | |||||||||
Mineral Reserve Statement - Rounded for Reporting | |||||||||
As at 30 June 2026 | |||||||||
Proven | Probable | Proven and Probable | |||||||
Operating Mine | Tonnes | Grade | Ounces Au ('000s) | Tonnes | Grade | Ounces Au ('000s) | Tonnes | Grade | Ounces Au ('000s) |
Big Bell UG | 6,329 | 1.72 | 349 | 4,771 | 2.83 | 434 | 11,100 | 2.19 | 783 |
Fender UG | 0 | 0.00 | 0 | 0 | 0.00 | 0 | 0 | 0.00 | 0 |
Great Fingall UG | 28 | 2.55 | 2 | 1,983 | 3.23 | 206 | 2,011 | 3.22 | 208 |
Golden Crown UG | 0 | 0.00 | 0 | 417 | 3.56 | 48 | 417 | 3.56 | 48 |
Bluebird Group UG | 1,195 | 2.37 | 91 | 4,979 | 2.67 | 428 | 6,174 | 2.62 | 519 |
Starlight UG | 2,484 | 2.82 | 225 | 1,285 | 2.39 | 99 | 3,769 | 2.67 | 324 |
Total | 10,035 | 2.07 | 667 | 13,437 | 2.81 | 1,215 | 23,472 | 2.49 | 1,882 |
Southern Goldfields Gold Operations | |||||||||
Mineral Reserve Statement - Rounded for Reporting | |||||||||
As at 30 June 2026 | |||||||||
Proven | Probable | Proven and Probable | |||||||
Operating Mine | Tonnes | Grade | Ounces Au | Tonnes | Grade | Ounces Au | Tonnes | Grade | Ounces Au ('000s) |
Beta Hunt | 2,167 | 1.79 | 125 | 19,506 | 2.41 | 1,509 | 21,674 | 2.34 | 1,634 |
Total | 2,167 | 1.79 | 125 | 19,506 | 2.41 | 1,509 | 21,674 | 2.34 | 1,634 |
Table 5 – Gold Mineral Reserves at 30 June 2026 for Westgold Non-Operating Projects
Non-operating Murchison projects | ||||||||||
Mineral Reserve Statement - Rounded for Reporting | ||||||||||
As at 30 June 2026 | ||||||||||
Proven | Probable | Proven and Probable | ||||||||
Project | Tonnes ('000s) | Grade | Ounces Au ('000s) | Tonnes ('000s) | Grade | Ounces Au ('000s) | Tonnes ('000s) | Grade | Ounces Au ('000s) | |
Big Bell District | 124 | 2.07 | 8 | 0 | 0.00 | 0 | 124 | 2.07 | 8 | |
Cuddingwarra | 84 | 1.29 | 3 | 221 | 1.24 | 9 | 305 | 1.25 | 12 | |
Day Dawn District | 0 | 0.00 | 0 | 14 | 1.83 | 1 | 14 | 1.83 | 1 | |
Tuckabianna | 0 | 0.00 | 0 | 591 | 2.24 | 43 | 591 | 2.24 | 43 | |
Tuckabianna Stockpiles | 87 | 2.16 | 6 | 3,760 | 0.70 | 85 | 3,847 | 0.73 | 91 | |
Meekatharra North | 0 | 0.00 | 0 | 0 | 0.00 | 0 | 0 | 0.00 | 0 | |
Nannine | 0 | 0.00 | 0 | 761 | 1.28 | 31 | 761 | 1.28 | 31 | |
Paddy's Flat | 48 | 4.10 | 6 | 435 | 3.86 | 54 | 483 | 3.88 | 60 | |
Yaloginda District | 0 | 0.00 | 0 | 240 | 1.34 | 10 | 240 | 1.34 | 10 | |
Bluebird Stockpiles | 137 | 2.89 | 13 | 29 | 0.91 | 1 | 167 | 2.54 | 14 | |
Fortnum District | 0 | 0.00 | 0 | 1,217 | 1.49 | 58 | 1,217 | 1.49 | 58 | |
Horseshoe | 0 | 0.00 | 0 | 391 | 1.91 | 24 | 391 | 1.91 | 24 | |
FGO Stockpiles | 290 | 1.28 | 12 | 390 | 0.67 | 8 | 680 | 0.93 | 20 | |
Total | 771 | 1.97 | 49 | 8,050 | 1.25 | 324 | 8,820 | 1.32 | 373 | |
Non-operating Southern Goldfields projects | ||||||||||
Mineral Reserve Statement - Rounded for Reporting | ||||||||||
As at 30 June 2026 | ||||||||||
Proven | Probable | Proven and Probable | ||||||||
Project | Tonnes ('000s) | Grade | Ounces Au ('000s) | Tonnes ('000s) | Grade | Ounces Au ('000s) | Tonnes ('000s) | Grade | Ounces Au ('000s) | |
HGO Central | 132 | 2.19 | 9 | 503 | 3.02 | 49 | 635 | 2.84 | 58 | |
HGO Greater | 0 | 0.00 | 0 | 609 | 4.07 | 80 | 609 | 4.07 | 80 | |
HGO Stockpiles | 1,391 | 0.79 | 35 | 275 | 0.74 | 6 | 1,665 | 0.78 | 42 | |
BHO Stockpiles | 0 | 0.00 | 0 | 0 | 0.00 | 0 | 0 | 0.00 | 0 | |
Total | 1,523 | 0.91 | 45 | 1,386 | 3.03 | 135 | 2,909 | 1.92 | 179 | |
Mineral Reserves are a subset of Measured and Indicated Mineral Resources only. All active open pit and underground operations were depleted to 30 June 2026, based on a data cut-off date of 31 March 2026.
Mineral Reserves have been generated from design studies at a Pre-Feasibility or Feasibility stage, using appropriate cost, geotechnical, slope angle, stope span, dilution, cut-off grade, mining recovery and metallurgical recovery parameters specific to each mine.
Mining methods applied are resource-specific and based on experience with similar orebodies. Deswik™ underground mining software, together with GEOVIA Whittle™ and GEOVIA Surpac™ open pit mining software, was used to create mine designs. A maximum gold price of $4,800/oz has been used to establish Mineral Reserves and determine appropriate cut-off grades.
Mining, milling and additional overhead costs are based on currently contracted and budgeted operating costs. Mill recoveries for all ore types are based on operating experience or metallurgical test work. Mineral Reserves consider environmental, tenement, government and infrastructure approvals, together with transportation requirements to market.
Stockpiles consist of ROM stocks and low-grade stocks mined by Westgold and accumulated by previous owners.
Material year-on-year changes to Westgold's gold Mineral Reserves include (see Figure 12 ):
Background to the Mineral Reserve
All Mineral Reserve inventories are based on detailed three-dimensional designs to ensure practical mining conditions are met. In addition, all Mineral Reserve inventories are above the mine-specific cut-off grades (COGs), contain only Measured and Indicated material, and incorporate the application of Modifying Factors.
Depending on the mining method, Modifying Factors are used to address hydrological, geotechnical, minimum width and blasting conditions. These factors are applied during the stope design process to ensure they are captured before scheduling and are relevant to the style of mineralisation, lithology and ground conditions encountered.
Cost modelling is completed for all deposits within the Mineral Reserve. For operating mines, costs are derived from actual and budgeted rates. For deposits under feasibility assessment, the costs applied are determined from a schedule of rates relevant to the mining method and expected production rates.
Open Pit Methodology
Mineral Reserves are based on pit designs, with appropriate modifications to the original pit shell outlines to ensure compliance with practical mining parameters.
Geotechnical parameters aligned with the open pit Mineral Reserves are based either on observations from existing pit geometries or on domain-specific expectations and assumptions. Various geotechnical reports and retrospective reconciliations are considered when determining design parameters.
Ore dilution through the mining process has been accounted for within the Mineral Reserve inventory. These ratios represent the style of mineralisation and mining method applied during mine planning. These Modifying Factors are determined from various lithological, geotechnical and hydrogeological data.
Minimum mining widths have been accounted for in the designs, with the use of 40t or 90t trucking parameters depending on the size of the pit excavation.
No specific ground support requirements are required beyond suitable pit slope design criteria based on specific geotechnical domains.
The mining sequence is included in the mine scheduling process used for economic evaluation and considers available operating time, equipment size and equipment performance.
No Inferred material is included within the open pit statement, although Inferred material is present in some pit shapes. In these situations, the Inferred material is classified as waste.
Underground Methodology
All underground Mineral Reserves are based on three-dimensional design strings and polygon-derived stope shapes, following the Measured and Indicated Mineral Resource Estimates in areas above the mine operating cut-off grade. A complete mine schedule is then derived from this design to create a Life of Mine plan and financial analysis.
Mining heights and widths are based on first principles and standardised mining methods widely used throughout Western Australia and those already employed at the operating mines.
Geotechnical evaluations have been used to determine stope dimensions, backfilling methodologies, mine sequencing and fundamental geotechnical parameters. Associated costs have been included in the study and budgeting frameworks.
In large, disseminated orebodies, sub-level caving, sub-level open stoping or single-level bench stoping production methods are used. In narrow-vein, laminated quartz-hosted domains, a conservative narrow-bench mining method is used. In narrow, flat-dipping deposits, flat long-hole mining is adopted, with footwall fillets used to account for the rill angle, and/or jumbo stoping.
Stope shape parameters are based on historical data, where available, or expected stable hydraulic radius dimensions derived from first-principles geotechnical data.
Modifying Factors, such as but not limited to minimum mining widths, dilution and ore recovery, are relevant to the style of mineralisation, ground conditions and, where appropriate, historical information.
Stope shape dimensions vary between mining methods. Hydraulic radii are applied to each method and are derived either from historical production or from geotechnical reports and recommendations. Where no data or exposure is available, conservative hydraulic radius values are used based on the contact domain type.
The mining sequence is included in the mine scheduling process used for economic evaluation and considers available operating time, equipment size and equipment performance.
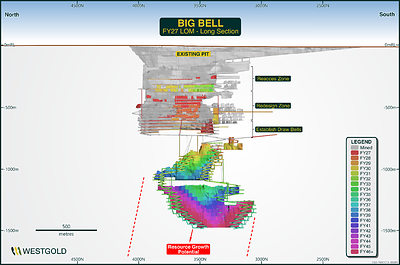
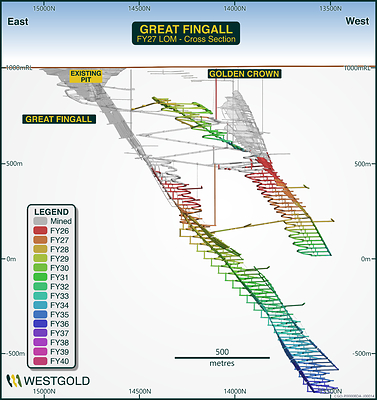
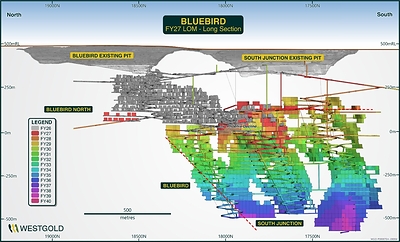
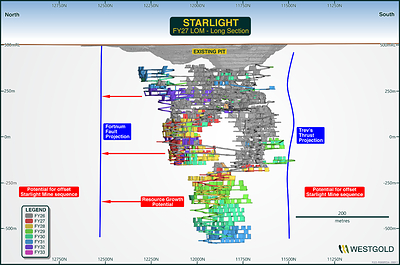
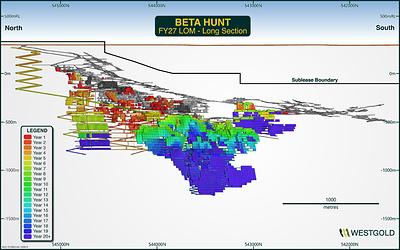
Figures 13 – 17 below depict Life of Mine schematics for Westgold's key operating mines.
Additional detailed information relating to generation of the Mineral Reserves is attached in AppendixA Table 1 – JORC 2012 Reporting Criteria.
Looking Forward
Westgold plans to invest $50–75M2 in exploration and resource development in FY27, subject to operational priorities, market conditions and Board approval. With 26 drill rigs currently active across the portfolio, this investment will maintain the Company's focus on converting Mineral Resources to MineralReserves and extending mine lives across its existing operations.
Near-term resource development will increasingly target opportunities capable of bringing value forward in the operating plan, including potential open-pit sources. In parallel, Westgold will continue to test the medium term potential of its extensive Western Australian portfolio, including opportunities at Big Bell South, Paddy's Flat and Cuddingwarra.
At Beta Hunt, drilling will continue to focus on expanding the Fletcher and Mason mineralised systems, which remain open in multiple directions and represents one of the most significant organic growth opportunities within Westgold's portfolio. Ongoing work is aimed at extending Mineral Resources and Mineral Reserves while improving confidence in the broader Fletcher system and evaluating its potential to support further increases in mining rates.
More broadly, Westgold views continued Mineral Reserve growth as a critical enabler of its long-term strategy to improve processing hub efficiency and maximise returns from existing infrastructure. As Mineral Resources are converted to Mineral Reserves and mine inventories continue to grow, the Company expects to progressively unlock opportunities to increase mining and processing rates across its hubs.
This work will support future mill expansion studies and the ongoing optimisation of hub-scale operating plans, ensuring processing capacity is available to efficiently convert Westgold's growing mineral inventory into sustained production and cash flow.
ThisannouncementisauthorisedforreleasetotheASXbythe Westgold Board.
Competent/Qualified Person Statements
Exploration Results and Mineral Resources Estimates
The information in this release that relates to Exploration results and Mineral Resource Estimates is compiled by Westgold technical employees and contractors under the supervision of Mr. Jake Russell B.Sc. (Hons), who is a member of the Australian Institute of Geoscientists and who has verified, reviewed and approved such information. Mr Russell is a full-time employee of the Company and has sufficient experience which is relevant to the styles of mineralisation and types of deposit under consideration and to the activities which he is undertaking to qualify as a Competent Person as defined in the 2012 Edition of the Australasian Code for Reporting of Exploration Results, Mineral Resources and Mineral Reserves (the "JORC Code") and as a Qualified Person as defined in the CIM Guidelines and National Instrument 43-101 – Standards of Disclosure for Mineral Projects ("NI 43-101"). Mr. Russell is an employee of the Company and, accordingly, is not independent for purposes of NI 43-101. Mr Russell consents to and approves the inclusion in this release of the matters based on his information in the form and context in which it appears. Mr Russell is eligible to participate in short- and long-term incentive plans of the company.
The Mineral Resource Estimates contained herein have an effective date of 30 June 2026 and were completed by Westgold technical employees and contractors under the supervision of Mr Jake Russell. The key inputs and assumptions are provided in Appendix C to this release including Section 1 – Sampling Techniques and Data, Section 2 – Reporting of Exploration Results, Section 3 – Estimation and Reporting of Mineral Resources and Section 4 – Estimation and Reporting of Mineral Reserves.
Mineral Reserves
The information in this release that relates to Mineral Reserves is based on information compiled by Mr. Leigh Devlin B.Eng. FAusIMM, who has verified, reviewed and approved such information. Mr. Devlin has sufficient experience which is relevant to the styles of mineralisation and types of deposit under consideration and to the activities which they are undertaking to qualify as a Competent Person as defined in the JORC Code and as a Qualified Person as defined in the CIM Guidelines and NI 43-101. Mr. Devlin is an employee of the Company and, accordingly, is not independent for purposes of NI 43-101. Mr. Devlin consents to and approves the inclusion in this release of the matters based on his information in the form and context in which it appears. Mr. Devlin is a full-time senior executive of the Company and is eligible to and may participate in short-term and long-term incentive plans of the Company as disclosed in its annual reports and disclosure documents.
General
Mineral Resources, Mineral Reserve Estimates and Exploration Targets and Results are calculated in accordance with the JORC Code. Investors outside Australia should note that while Mineral Reserve and Mineral Resource estimates of the Company in this announcement comply with the JORC Code (such JORC Code-compliant Mineral Reserves and Mineral Resources being " Mineral Reserves" and "Mineral Resources" respectively), they may not comply with the relevant guidelines in other countries. The JORC Code is an acceptable foreign code under NI 43-101. Information contained in this release describing mineral deposits may not be comparable to similar information made public by companies subject to the reporting and disclosure requirements of US securities laws, including Item 1300 of Regulation S-K. All technical and scientific information in this release has been prepared in accordance with the Canadian regulatory requirements set out in NI 43-101 and has been reviewed on behalf of the Company by Qualified Persons, as set forth above.
This release contains references to estimates of Mineral Resources and Mineral Reserves.
The estimation of Mineral Resources is inherently uncertain and involves subjective judgments about many relevant factors. Mineral Resources that are not Mineral Reserves do not have demonstrated economic viability. The accuracy of any such estimates is a function of the quantity and quality of available data, and of the assumptions made and judgments used in engineering and geological interpretation, which may prove to be unreliable and depend, to a certain extent, upon the analysis of drilling results and statistical inferences that may ultimately prove to be inaccurate. Mineral Resource estimates may require re-estimation based on, among other things: (i) fluctuations in the price of gold; (ii) results of drilling; (iii) results of metallurgical testing, process and other studies; (iv) changes to proposed mine plans; (v) the evaluation of mine plans subsequent to the date of any estimates; and (vi) the possible failure to receive required permits, approvals and licenses.
Technical Reports
Westgold has prepared the following NI 43-101 compliant technical reports which support the information contained herein, each of which is available under Westgold's profile on SEDAR+ at www.sedarplus.ca :
Reference should be made to the full text of the foregoing technical reports for the assumptions, qualifications and limitations relating to the Mineral Resource Estimates and Mineral Reserves contained therein and herein.
Forward Looking Statements
These materials prepared by Westgold include forward looking statements. Often, but not always, forward looking statements can generally be identified by the use of forward looking words such as "may", "will", "expect", "intend", "believe", "forecast", "predict", "plan", "estimate", "anticipate", "continue", and "guidance", or other similar words and may include, without limitation, statements regarding plans, strategies and objectives of management, anticipated production or construction commencement dates and expected costs or production outputs.
Forward looking statements inherently involve known and unknown risks, uncertainties and other factors that may cause the Company's actual results, performance and achievements to differ materially from any future results, performance or achievements. Relevant factors may include, but are not limited to, changes in commodity prices, foreign exchange fluctuations and general economic conditions, increased costs and demand for production inputs, the speculative nature of exploration and project development, including the risks of obtaining necessary licenses and permits and diminishing quantities or grades of reserves, political and social risks, changes to the regulatory framework within which the Company operates or may in the future operate, environmental conditions including extreme weather conditions, recruitment and retention of personnel, industrial relations issues and litigation.
Forward looking statements are based on the Company and its management's good faith assumptions relating to the financial, market, regulatory and other relevant environments that will exist and affect the Company's business and operations in the future. The Company does not give any assurance that the assumptions on which forward looking statements are based will prove to be correct, or that the Company's business or operations will not be affected in any material manner by these or other factors not foreseen or foreseeable by the Company or management or beyond the Company's control.
Although the Company attempts and has attempted to identify factors that would cause actual actions, events or results to differ materially from those disclosed in forward looking statements, there may be other factors that could cause actual results, performance, achievements or events not to be as anticipated, estimated or intended, and many events are beyond the reasonable control of the Company. In addition, the Company's actual results could differ materially from those anticipated in these forward looking statements as a result of the factors outlined in the "Risk Factors" section of the Company's continuous disclosure filings available on SEDAR+ or the ASX, including, in the Company's current annual report, half year report or most recent management discussion and analysis.
Accordingly, readers are cautioned not to place undue reliance on forward looking statements. Forward looking statements in these materials speak only at the date of issue. Subject to any continuing obligations under applicable law or any relevant stock exchange listing rules, in providing this information the Company does not undertake any obligation to publicly update or revise any of the forward-looking statements or to advise of any change in events, conditions or circumstances.
Appendix A – JORC 2012 Table 1– Gold Division
SECTION 1: SAMPLING TECHNIQUES AND DATA
(Criteria in this section apply to all succeeding sections.)
Criteria | JORC Code Explanation | Commentary |
Sampling techniques |
|
|
Drilling techniques | ||
Drill sample recovery | ||
Logging |
|
|
Sub-sampling techniques and sample preparation |
|
|
Quality of assay data and laboratory tests |
|
|
Verification of sampling and assaying |
|
|
Location of data points |
|
|
Data spacing and distribution |
|
|
Orientation of data in relation to geological structure |
|
|
Sample security |
|
|
Audits or reviews |
|
|
SECTION 2: REPORTING OF EXPLORATION RESULTS
(Criteria listed in the preceding section also apply to this section.)
Criteria | JORC Code Explanation | Commentary |
Mineral tenement and land tenure status |
|
|
Exploration done by other parties |
|
|
Geology |
| BHO
|
CGO
| ||
FGO
| ||
HGO
| ||
MGO
| ||
Drill hole Information |
|
|
Data aggregation methods |
|
|
Relationship between mineralisation widths and intercept lengths |
|
|
Diagrams |
|
|
Balanced reporting |
|
|
Other substantive exploration data |
|
|
Further work |
|
|
SECTION 3: ESTIMATION AND REPORTING OF MINERAL RESOURCES
(Criteria listed in section 1, and where relevant in section 2, also apply to this section.)
Criteria | JORC Code Explanation | Commentary |
Database integrity |
|
|
Site visits |
|
|
Geological interpretation |
|
|
Dimensions |
| BHO
CGO
FGO
HGO
MGO
STOCKPILES
|
Estimation and modelling techniques. |
|
Datashed – front end to a SQL Database, Leapfrog - Drill hole validation, structural analysis and stereonets, material type, lithology, alteration and faulting wireframes, domaining and mineralisation wireframes, geophysics and regional geology. Snowden Supervisor - geostatistics, variography, declustering, top-cut, kriging neighbourhood analysis (KNA), model validation. Surpac - drill hole validation, block modelling, geostatistics, CIK, OK estimation, block model validation, classification, depletion and reporting.
|
Moisture |
|
|
Cut-off parameters |
|
|
Mining factors or assumptions |
|
|
Metallurgical factors or assumptions |
|
|
Environmental factors or assumptions |
|
|
Bulk density |
|
|
Classification |
|
|
Audits or reviews |
|
|
Discussion of relative accuracy/confidence |
|
|
SECTION 4: ESTIMATION AND REPORTING OF MINERAL RESERVES
(Criteria listed in section 1, and where relevant in sections 2 and 3, also apply to this section.)
Criteria | JORC Code Explanation | Commentary |
Mineral Resource estimate for conversion to Mineral Reserves |
|
|
Site visits |
|
|
Study status |
|
|
Cut-off parameters |
|
|
Mining factors or assumptions |
|
Open Pit Methodology
|
Underground Methodology
| ||
Metallurgical factors or assumptions |
| BHO
CGO
|
FGO
HGO
MGO
| ||
Environmental |
| BHO
CGO
FGO
HGO
MGO
|
| ||
Infrastructure |
| BHO
CGO
FGO
HGO
MGO
|
Costs |
| BHO
CGO
FGO
HGO
MGO
|
Revenue factors |
|
|
Market assessment |
|
|
Economic |
|
|
Social |
| BHO
CGO
FGO
HGO
MGO
|
Other |
|
|
Classification |
|
|
Audits or reviews |
|
|
Discussion of relative accuracy/ confidence |
|
|
Appendix B – JORC 2012 Table 1– Nickel Division
SECTION 1: SAMPLING TECHNIQUES AND DATA
(Criteria in this section apply to all succeeding sections.)
Criteria | JORC Code Explanation | Commentary |
Sampling techniques |
|
|
Drilling techniques |
|
|
Drill sample recovery |
|
|
Logging |
|
|
Sub-sampling techniques and sample preparation |
|
|
Quality of assay data and laboratory tests |
|
|
Verification of sampling and assaying |
|
|
Location of data points |
|
|
Data spacing and distribution |
|
|
Orientation of data in relation to geological structure |
|
|
Sample security |
|
|
Audits or reviews |
|
|
SECTION 2: REPORTING OF EXPLORATION RESULTS
(Criteria listed in the preceding section also apply to this section.)
Criteria | JORC Code Explanation | Commentary |
Mineral tenement and land tenure status |
|
|
Exploration done by other parties |
|
|
Geology |
|
|
Drill hole Information |
|
|
Data aggregation methods |
|
|
Relationship between mineralisation widths and intercept lengths |
|
|
Diagrams |
|
|
Balanced reporting |
|
|
Other substantive exploration data |
|
|
Further work |
|
|
SECTION 3: ESTIMATION AND REPORTING OF MINERAL RESOURCES
(Criteria listed in section 1, and where relevant in section 2, also apply to this section.)
Criteria | JORC Code Explanation | Commentary |
Database integrity |
|
|
Site visits |
|
|
Geological interpretation |
|
|
Dimensions |
|
|
Estimation and modelling techniques. |
|
|
Moisture |
|
|
Cut-off parameters |
|
|
Mining factors or assumptions |
|
|
Metallurgical factors or assumptions |
|
|
Environmental factors or assumptions |
|
|
Bulk density |
|
|
Classification |
|
|
Audits or reviews |
|
|
Discussion of relative accuracy/ confidence |
|
|
SECTION 4: ESTIMATION AND REPORTING OF MINERAL RESERVES
(Criteria listed in section 1, and where relevant in sections 2 and 3, also apply to this section.)
Criteria | JORC Code Explanation | Commentary |
Mineral Resource estimate for conversion to Mineral Reserves |
|
|
Site visits |
|
|
Study status |
|
|
Cut-off parameters |
|
|
Mining factors or assumptions |
| |
Metallurgical factors or assumptions |
|
|
Environmental |
|
|
Infrastructure |
|
|
Costs |
|
|
Revenue factors |
|
|
Market assessment |
|
|
Economic |
|
|
Social |
|
|
Other |
|
|
Classification |
|
|
Audits or reviews |
|
|
Discussion of relative accuracy/ confidence |
|
|

SOURCE Westgold Resources Limited

20 augusti, 10:07
Canada NewsWire
PERTH, Australia, Aug. 20, 2026
Mineral Reserve ounces up 41%, grade up 15% - at a Reserve addition cost of $27/oz
PERTH, Australia , Aug. 20, 2026 /CNW/ -- Westgold Resources Limited (ASX: WGX) (TSX: WGX) (Westgold or the Company) is pleased to provide its updated Mineral Resource Estimate (MRE) and Mineral Reserve Statement, calculated as at 30 June 2026.
Group Gold Mineral Resource Estimate and
| As at 30 June 2026 |
Measured MRE | 30Mt at 2.36g/t Au for 2.3Moz |
Indicated MRE | 89Mt at 2.35g/t Au for 6.7Moz |
Measured & Indicated MRE | 119Mt at 2.35g/t Au for 9.0Moz |
Inferred MRE | 75Mt at 2.23g/t Au for 5.4Moz |
Proven Mineral Reserves | 15Mt at 1.90g/t Au for 0.9Moz |
Probable Mineral Reserves | 42Mt at 2.34g/t Au for 3.2Moz |
Proven and Probable Mineral Reserves | 57Mt at 2.22g/t Au for 4.1Moz |
* Westgold reports Mineral Resources inclusive of Mineral Reserves. Inferred Mineral Resources are reported separately from Measured and Indicated Mineral Resources and should not be interpreted as having the same level of confidence. |
Highlights
41% increase in Proven and Probable Mineral Reserve to 4.1Moz, post mining depletion and adjusting for non-core asset divestment – achieved at a modest reserve addition investment of just $27/oz.
15% increase in Proven and Probable Mineral Reserve grade to 2.22g/t (FY25: 1.93g/t) – marking the third consecutive year of Reserve growth after mining depletion.
Circa 10 year Reserve life maintained – approximately 10 years of Reserve inventory at current Group installed processing capacity.
26 drill rigs operating across portfolio – on surface and underground supporting resource growth and conversion activities.
$50–75M2 planned investment in FY27 exploration and resource development drilling – targeting both near-term Reserve growth opportunities and medium term organic growth options.
Westgold Managing Director and CEO Wayne Bramwell commented:
"Westgold's FY26 Mineral Resources and Mineral Reserves statement reflects the quality of the asset base and the breadth of our portfolio. Focused capital allocation into our largest mines continues to deliver material value, with FY26 marking a third consecutive year of Mineral Reserve growth.
Importantly, Group Mineral Resources increased after adjusting the prior-year comparative for the divestment of non-core assets 1 . This demonstrates the organic growth potential of our core assets within the streamlined portfolio.
But we did not just grow our inventory in FY26; we improved its quality, with both Resource and Reserve grades increasing year-on-year while lifting Resource confidence across the portfolio by increasing the proportion of the Measured and Indicated Resource category. Importantly, this growth was generated organically at a cost of circa $27/oz and resulted in more than 1.5Moz of gross Mineral Reserve additions.
With $50–75M 2 planned for exploration and resource development in FY27 and 26 drill rigs active across the Murchison and Southern Goldfields, Westgold is investing to convert more of its large Resource base into higher-confidence Reserves, extend mine life and strengthen future production options. This disciplined organic growth strategy is designed to build on FY26 momentum and create enduring value for shareholders."
2026 Mineral Resource Estimate
As at 30 June 2026, the gold Measured and Indicated Mineral Resource Estimate for the Westgold business was 119Mt at 2.35g/t Au for 9.0Moz and the Inferred Mineral Resource estimate was 75Mt at 2.23g/t Au for 5.4Moz .
This represents considerable growth in the Company's gold Mineral Resource base year-on-year, after adjusting for divestment of the non-core assets of Peak Hill, Reedy's, Comet, Chalice and Mount Henry 1 .
This growth highlights the ongoing exploration and resource development potential of Westgold's Western Australian landholdings.
Tables 1, 2 and 3 below present the FY26 Mineral Resource Estimates for the Murchison and Southern Goldfields operations.
Figures 1, 2 and 3 below map Westgold's portfolio which spans 2,500km 2 .
_________________________________ |
1 Refer to the Company's ASX announcements titled "Completion of the Mt Henry-Selene Gold Project Divestment" dated 16 February 2026, "Westgold Completes Demerger of Non-Core Assets to Valiant" dated 13 March 2026, "Completion of the Chalice Gold Project Divestment" dated 9 July 2026 and "Completion of the Peak Hill Gold Project Divestment" dated 1 July 2026 for further information regarding the non-core asset divestments. |
2 This reflects the current intentions of the Company and is subject to operational priorities, market conditions and Board approval. Accordingly, this planned investment may be subject to change. |
Table 1 – Gold Mineral Resource Estimates as at 30 June 2026 for Westgold operating mines
Murchison Gold Operations | ||||||||||||
Mineral Resource Statement – rounded for reporting | ||||||||||||
As at 30 June 2026 | ||||||||||||
Measured | Indicated | Measured and Indicated | Inferred | |||||||||
Operating mine | Tonnes
| Grade | Ounces
| Tonnes
| Grade | Ounces
| Tonnes
| Grade | Ounces
| Tonnes
| Grade | Ounces
|
Big Bell UG | 7,504 | 2.17 | 523 | 8,684 | 3.10 | 865 | 16,188 | 2.67 | 1,388 | 9,001 | 2.94 | 851 |
Fender UG | 100 | 2.78 | 9 | 139 | 2.57 | 11 | 239 | 2.66 | 20 | 112 | 2.79 | 10 |
Great Fingall UG | 63 | 3.59 | 7 | 2,301 | 4.14 | 306 | 2,363 | 4.13 | 313 | 1,113 | 2.78 | 99 |
Golden Crown UG | 0 | 0.00 | 0 | 471 | 5.87 | 89 | 471 | 5.87 | 89 | 2,100 | 3.08 | 208 |
Bluebird Group UG | 1,292 | 3.11 | 129 | 8,203 | 2.93 | 773 | 9,495 | 2.95 | 902 | 6,489 | 2.53 | 528 |
Starlight UG | 4,991 | 3.01 | 483 | 2,636 | 2.26 | 192 | 7,628 | 2.75 | 675 | 4,353 | 2.08 | 291 |
Total | 13,950 | 2.57 | 1,151 | 22,434 | 3.10 | 2,236 | 36,384 | 2.90 | 3,388 | 23,168 | 2.67 | 1,987 |
Southern Goldfields Gold Operations | ||||||||||||
Mineral Resource Statement – rounded for reporting | ||||||||||||
As at 30 June 2026 | ||||||||||||
Measured | Indicated | Measured and Indicated | Inferred | |||||||||
Operating mine | Tonnes ('000s) | Grade | Ounces Au ('000s) | Tonnes ('000s) | Grade | Ounces Au ('000s) | Tonnes ('000s) | Grade | Ounces Au ('000s) | Tonnes ('000s) | Grade | Ounces Au ('000s) |
Two Boys | 84 | 5.31 | 14 | 212 | 3.25 | 22 | 296 | 3.84 | 37 | 75 | 3.03 | 7 |
Lake Cowan | 40 | 1.57 | 2 | 104 | 1.21 | 4 | 144 | 1.31 | 6 | 19 | 1.27 | 1 |
Beta Hunt | 10,682 | 2.21 | 759 | 31,531 | 2.43 | 2,463 | 42,212 | 2.37 | 3,222 | 32,392 | 2.08 | 2,170 |
Total | 10,806 | 2.23 | 775 | 31,847 | 2.43 | 2,489 | 42,652 | 2.38 | 3,265 | 32,487 | 2.09 | 2,178 |
Table 2 – Gold Mineral Resource Estimates as at 30 June 2026 for Westgold non-operating projects
Non-operating Murchison projects | ||||||||||||
Mineral Resource Statement – rounded for reporting | ||||||||||||
As at 30 June 2026 | ||||||||||||
Measured | Indicated | Measured and Indicated | Inferred | |||||||||
Project | Tonnes ('000s) | Grade | Ounces Au ('000s) | Tonnes ('000s) | Grade | Ounces Au ('000s) | Tonnes ('000s) | Grade | Ounces Au ('000s) | Tonnes ('000s) | Grade | Ounces Au ('000s) |
Big Bell District | 157 | 2.65 | 13 | 664 | 2.55 | 54 | 821 | 2.57 | 68 | 1,828 | 2.95 | 174 |
Cuddingwarra | 194 | 1.66 | 10 | 1,689 | 1.58 | 86 | 1,882 | 1.59 | 96 | 542 | 1.49 | 26 |
Day Dawn District | 78 | 1.65 | 4 | 1,101 | 1.98 | 70 | 1,179 | 1.96 | 74 | 1,040 | 1.82 | 61 |
Tuckabianna | 58 | 1.83 | 3 | 1,619 | 2.59 | 135 | 1,677 | 2.57 | 139 | 1,631 | 2.65 | 139 |
Tuckabianna Stockpiles | 87 | 2.16 | 6 | 3,760 | 0.70 | 85 | 3,847 | 0.73 | 91 | 0 | 0.00 | 0 |
Meekatharra North | 0 | 0.00 | 0 | 97 | 1.98 | 6 | 97 | 1.98 | 6 | 75 | 2.11 | 5 |
Nannine | 74 | 2.42 | 6 | 1,120 | 1.85 | 67 | 1,194 | 1.88 | 72 | 355 | 2.22 | 25 |
Paddy's Flat | 376 | 3.67 | 44 | 7,125 | 1.88 | 431 | 7,501 | 1.97 | 475 | 2,401 | 2.00 | 154 |
Yaloginda District | 54 | 2.69 | 5 | 4,300 | 1.47 | 204 | 4,354 | 1.49 | 208 | 5,842 | 1.38 | 259 |
Bluebird Stockpiles | 137 | 2.89 | 13 | 29 | 0.91 | 1 | 167 | 2.54 | 14 | 0 | 0.00 | 0 |
Fortnum District | 1,370 | 2.35 | 104 | 5,992 | 1.65 | 319 | 7,362 | 1.78 | 422 | 1,831 | 1.33 | 78 |
Horseshoe | 0 | 0.00 | 0 | 1,720 | 1.91 | 106 | 1,720 | 1.91 | 106 | 385 | 1.66 | 21 |
FGO Stockpiles | 290 | 1.28 | 12 | 390 | 0.67 | 8 | 680 | 0.93 | 20 | 15 | 0.54 | 0 |
Total | 2,876 | 2.38 | 220 | 29,607 | 1.65 | 1,571 | 32,483 | 1.72 | 1,791 | 15,945 | 1.84 | 942 |
Non-operating Southern Goldfields projects | ||||||||||||
Mineral Resource Statement - Rounded for Reporting | ||||||||||||
As at 30 June 2026 | ||||||||||||
Measured | Indicated | Measured and Indicated | Inferred | |||||||||
Project | Tonnes ('000s) | Grade | Ounces Au ('000s) | Tonnes ('000s) | Grade | Ounces Au ('000s) | Tonnes ('000s) | Grade | Ounces Au ('000s) | Tonnes ('000s) | Grade | Ounces Au ('000s) |
HGO Central | 931 | 2.94 | 88 | 2,991 | 2.58 | 248 | 3,922 | 2.67 | 336 | 1,642 | 2.81 | 148 |
HGO Greater | 8 | 1.73 | 0 | 1,893 | 2.82 | 172 | 1,901 | 2.82 | 172 | 1,568 | 2.12 | 107 |
HGO Stockpiles | 1,391 | 0.79 | 35 | 275 | 0.74 | 6 | 1,665 | 0.78 | 42 | 0 | 0.00 | 0 |
BHO Stockpiles | 0 | 0.00 | 0 | 0 | 0.00 | 0 | 0 | 0 | 0 | 0 | 0.00 | 0 |
Total | 2,330 | 1.65 | 124 | 5,158 | 2.57 | 426 | 7,488 | 2.28 | 550 | 3,210 | 2.47 | 255 |
Table 3 – Nickel Mineral Resource Estimates at 30 June 2026 for Beta Hunt
Beta Hunt Nickel Operations | ||||||||||||
Mineral Resource Statement - Rounded for Reporting | ||||||||||||
As at 30 June 2026 | ||||||||||||
Measured | Indicated | Measured and Indicated | Inferred | |||||||||
Project | Tonnes ('000s) | Ni (%) | NiT | Tonnes ('000s) | Ni (%) | NiT ('000s) | Tonnes ('000s) | Ni (%) | NiT | Tonnes ('000s) | Ni (%) | NiT |
Beta Hunt | 0 | 0.0 | 0 | 749 | 2.8 | 21 | 749 | 2.8 | 21 | 499 | 2.7 | 13 |
Total | 0 | 0.0 % | 0 | 749 | 2.8 % | 21 | 749 | 2.8 % | 21 | 499 | 2.7 % | 13 |
Additional detailed information relating to generation of the Mineral Resource Estimates is attached in Appendix A & B Table 1 – JORC 2012 Reporting Criteria.
Geology
Murchison
The Meekatharra Gold Operation is located in the Archaean Murchison Province, a granite-greenstone terrane in the north-western Yilgarn Craton. North-northeast-trending greenstone belts are separated by granite-gneiss domes, with smaller granite plutons also present within, or on the margins of, the belts.
The Paddy's Flat area is located on the western limb of a regional fold, the Polelle Syncline, within a sequence of mafic to ultramafic volcanic rocks with minor interflow sediments and banded iron-formation. The sequence was intruded by felsic porphyry dykes prior to mineralisation.
Mineralisation at Paddy's Flat occurs along four sub-parallel trends and comprises sulphide-replacement BIF-hosted gold, quartz-vein-hosted shear-related gold, and quartz-carbonate-sulphide stockwork vein- and alteration-related gold.
The Yaloginda area, which hosts Bluebird–South Junction, is a gold-bearing Archaean greenstone belt situated approximately 15km south of Meekatharra. The deposits in the area are hosted within a strained and metamorphosed volcanic sequence consisting primarily of ultramafic rocks and high-magnesium basalt, with minor komatiite, peridotite, gabbro, tholeiitic basalt and interflow sediments.
The sequence was intruded by a variety of felsic porphyry and intermediate sills and dykes.
The Cue Gold Operations are located in the Archaean Murchison Province, a granite-greenstone terrane in the north-western Yilgarn Craton. North-northeast-trending greenstone belts are separated by granite-gneiss domes, with smaller granite plutons also present within, or on the margins of, the belts.
Mineralisation at Big Bell is hosted within the shear zone, known as the Big Bell Mine Sequence, and is associated with post-peak metamorphic retrograde assemblages. Stibnite, native antimony and trace arsenopyrite are disseminated through the K-feldspar-rich lode schist. These minerals are intergrown with pyrite, pyrrhotite and chalcopyrite. Mineralisation outside the typical Big Bell host rocks (KPSH), including 1,600N and Shocker, also displays a very strong W-As-Sb geochemical halo.
Numerous gold deposits occur within the Cuddingwarra Project area, the majority of which are hosted within the central mafic-ultramafic ± felsic porphyry sequence. Within this broad framework, mineralisation is interpreted to be spatially controlled by competency contrasts across, and flexures along, layer-parallel D2 shear zones, and is maximised where transected by corridors of northeast-striking D3 faults and fractures.
The Great Fingall Dolerite hosts the majority of gold mineralisation within the portion of the greenstone belt proximal to Cue, known as the Day Dawn Project Area. Unit AGF3 is the most brittle of the five units, and this characteristic is responsible for its role as the most favourable lithological host for gold mineralisation in the greenstone belt.
The Fortnum deposits are Palaeoproterozoic shear-hosted gold deposits within the Fortnum Wedge, a localised thrust duplex of the Narracoota Formation within the overlying Ravelstone Formation. Both stratigraphic formations form part of the Bryah Basin in the Capricorn Orogen, Western Australia.
The Horseshoe Cassidy deposits are hosted within the Ravelstone Formation, comprising siltstone and argillite, and the Narracoota Formation, comprising highly altered, moderately to strongly deformed mafic to ultramafic rocks. The main zone of mineralisation is developed within a horizon of highly altered magnesian basalt.
Gold mineralisation is associated with strong vein stockworks confined to the altered mafic unit. Alteration comprises proximal silica-carbonate-fuchsite-haematite-pyrite stockwork and distal silica-haematite-carbonate ± chlorite assemblages.
Southern Goldfields
The Beta Hunt Gold Operations are situated within the central portion of the Norseman-Wiluna greenstone belt, in a sequence of mafic, ultramafic and felsic rocks on the south-western flank of the Kambalda Dome. Gold mineralisation occurs mainly in sub-vertical shear zones within the Lunnon Basalt and is characterised by shear-hosted and extensional quartz veining within a halo of biotite-pyrite alteration.
Within these shear zones, coarse gold locally occurs where the shear zones intersect iron-rich sulphidic metasediments in the Lunnon Basalt, or nickel sulphides at the base of the Kambalda Komatiite (ultramafic rocks). The mineralised shears are represented by the A Zone, Western Flanks, Fletcher, Larkin and Mason zones.
The Higginsville Gold Operation is located in the Eastern Goldfields Superterrane of the Archaean Yilgarn Craton. The majority of the Higginsville tenement package is located within the well-mineralised Kalgoorlie Terrane, between the gold-mining centres of Norseman and St Ives. HGO can be subdivided into five major geological domains: Trident Line of Lode, Lake Cowan, Southern Palaeochannels, Polar Bear Group and Spargo's Project area.
The majority of mineralisation along the Trident Line of Lode is hosted within the Poseidon Gabbro and high-MgO dyke complexes to the south. The Poseidon Gabbro is a thick, weakly differentiated gabbroic sill that strikes north-south, dips 60° to the east, is more than 500 m thick and is 2.5km long. Mineralisation is hosted within, or marginal to, quartz veining and is structurally and lithologically controlled.
The Lake Cowan project area is situated near the centre of a regional anticline between the Zuleika and Lefroy shears. The local geology is made more complex by the intrusion of the massive Proterozoic Binneringie Dyke. The majority of mineralisation at the Lake Cowan Mining Centre is hosted within an enclave of Archaean material surrounded by the Binneringie Dyke.
Mineralised zones within the Southern Palaeochannels network comprise both placer gold, typically near the base of the channel-fill sequences, and chemically precipitated secondary gold within the channel-fill materials and underlying saprolite. These gold concentrations commonly overlie, or are adjacent to, primary mineralised zones within Archaean bedrock.
The Polar Bear project is situated within the Archaean Norseman-Wiluna Belt, which locally includes basalts, komatiites, metasediments and felsic volcaniclastics. Primary gold mineralisation is related to hydrothermal activity during multiple deformation events. Available indications suggest that gold mineralisation is focused on, or near, the stratigraphic boundary between the Killaloe and Buldania formations.
The Spargo's Project occurs within the Coolgardie Domain of the Kalgoorlie Terrane. The area is bounded by the Zuleika Shear to the east and the Kunanalling Shear to the west. The geological setting comprises tightly folded, north-south-striking ultramafic and mafic volcanic rocks at the northern closure of the Widgiemooltha Dome.
The project lies on the general trend of the Kunanalling-Karramindie Shear corridor, a regional shear zone that hosts significant mineralisation to the north at Ghost Crab (Mount Marion), Wattle Dam to the south, the Penfolds Group and Kunanalling. The regionally prospective Zuleika Shear lies to the east of the project. The tenements are prospective for vein- and shear-hosted gold deposits, as demonstrated by Spargo's Reward and numerous other gold workings and occurrences.
Gold mineralisation at Spargo's Reward is hosted by a coarse-grained pyrite-arsenopyrite lode within quartz-sericite schists, between strongly biotite-altered greywacke to the east and quartz-sericite-fuchsite-pyrite-altered felsic tuff to the west. Gold mineralisation is associated with very little quartz veining, which is atypical for many deposits in the region. The Spargo's Reward setting has been described variously as a low-quartz sulphidic mesothermal gold system or as a Hemlo-style syn-sedimentary occurrence.
Background to the Mineral Resource Estimate
Geological interpretation of individual deposits is carried out using a systematic approach to ensure that the resulting Mineral Resource Estimates are both sufficiently constrained and representative of the expected subsurface conditions. In all aspects of Mineral Resource Estimation, factual and interpreted geology is used to guide the development of the interpretation. Geological matrices are established to assist with the interpretation and construction of estimation domains.
A significant portion of the data used in Mineral Resource Estimates has been gathered from diamond core, with multiple core sizes used. The core is geologically logged and subsequently halved for sampling. Grade control holes may be whole-cored to streamline the core-handling process, if required. Face sampling data is also used, with each development face or round chip sampled. Sampling intervals are domained by geological constraints, such as rock type, veining, alteration and sulphidation.
All geological input is logged and validated by the relevant area geologists, including an assessment of sample recovery. No defined relationship exists between sample recovery and grade, and no sample bias due to preferential loss or gain of fine or coarse material has been noted at any deposit.
Faces are nominally chip sampled horizontally across the face from left to right, or vertically from top to bottom, and sub-set according to geological features as appropriate. Diamond drilling is half-core niche sampled, or whole-cored where appropriate, and sub-set according to geological features as appropriate.
Samples undergo fine pulverisation of the entire sample using an LM5-type mill to achieve a 75µm product prior to splitting. QA/QC is maintained during the sub-sampling process through the systems of an independent NATA/ISO-accredited laboratory contractor. The sample size is considered appropriate for the grain size of the material being sampled. The unsampled half of diamond core is retained for check sampling, if required.
Samples are analysed for gold by fire assay, whereby a 40g to 50g sample undergoes fire assay lead collection followed by flame atomic absorption spectrometry. Quality control is maintained through the use of standards, blanks and duplicates. The laboratory includes a minimum of one project standard with every 22 samples analysed. No significant QA/QC issues have arisen in recent drilling results.
PhotonAssay™ was introduced in 2023 for Beta Hunt gold grade control samples. PhotonAssay™ technology, developed by Chrysos Corporation Limited, is a rapid, non-destructive method for analysing gold and other elements in mineral samples. It is based on the principle of gamma activation, which uses high-energy X-rays to excite changes in the nuclear structure of selected elements. The decay is then measured to provide a gold analysis. Each sample is run through two cycles, with a radiation time of 15 seconds. This methodology is insensitive to material type and therefore does not require fluxing chemicals, unlike fire assay. This technique was discontinued in 2024.
Nickel analyses have been completed by four-acid digest, with final analysis using ICP-OES.
After validating the drillhole data to be used in the estimate, interpretation of the orebody is undertaken to create the intervals that form the basis of the three-dimensional orebody wireframe. Wireframing is then carried out using a combination of automated modelling algorithms and manual triangulation to create an accurate three-dimensional representation of the subsurface mineralised body.
Drillhole intersections within the mineralised body are then used to flag the appropriate sections of the drillhole database tables for compositing purposes. Drillholes are subsequently composited to allow grade estimation. In all aspects of resource estimation, factual and interpreted geology is used to guide the development of the interpretation.
Once the sample data has been composited, statistical analysis is undertaken to assist in determining estimation search parameters and top-cuts. Analysis of individual domains is undertaken to determine appropriate search parameters, which are then incorporated with observed geological and geometrical features to determine the most appropriate estimation approach.
An empty block model is then created for the area of interest. This model contains attributes set at background values for the various elements of interest, as well as density and estimation parameters that are subsequently used to assist with resource categorisation. The block sizes used in the model vary depending on orebody geometry, minimum mining units, estimation parameters and the level of informing data available.
Grade estimation is then undertaken. Ordinary Kriging is considered the standard estimation method, although Categorical Indicator Kriging is used in some instances. Estimation results are validated against primary input data, previous estimates and mining output.
The Mineral Resource is then depleted for mining voids and classified in accordance with the JORC Code, using a combination of estimation-derived parameters and geological and mining knowledge.
Data spacing varies depending on the individual lode under consideration.
This approach considers all relevant factors and reflects the Competent Person's view of the deposit.
The cut-off grades used for reporting Mineral Resource Estimates are selected based on the style of mineralisation, depth below surface, most probable extraction technique and associated costs.
Likely mining approaches have been considered during domaining, estimation and classification. However, no mining dilution or ore loss has been modelled in the resource model or applied to the reported Mineral Resource Estimate. Metallurgical recovery has also not been applied to the reported Mineral Resource Estimate.
These factors are applied during the Mineral Reserve generation process.
Figures 4-10 depict the Resource Schematics for Westgold's key operating mines and growth projects.
Westgold nickel Mineral Resources have remained static year-on-year.
2026 Mineral Reserves
Figure 11 depicts Westgold's Proven and Probable Mineral Reserves and cumulative depletion since 2017. As at 30 June 2026, Proven and Probable Mineral Reserves were 57Mt at 2.22 g/t Au for 4.1Moz of gold .
This represents 41% growth in Westgold's gold Proven and Probable Mineral Reserves since FY25 after adjusting for divestment of non-core assets 1 (see Figure 12 ). Importantly, average Mineral Reserve grade increased 15% from 1.93g/t to 2.22g/t, demonstrating that growth was not achieved through the addition of lower-quality ounces, but through the successful conversion of higher-confidence and higher-grade Mineral Resources. This marks the third consecutive year of Mineral Reserve growth after mining depletion, underpinned by the maiden Fletcher Mineral Reserve 3 at Beta Hunt and continued investment in exploration and resource drilling.
FY26 drilling delivered approximately 1.5Moz of gross Mineral Reserve additions from exploration and resource development expenditure of approximately $42M, resulting in an Mineral Reserve conversion cost of an outstanding $27/oz 4 — a highly competitive outcome compared to the cost of acquiring Reserve ounces inorganically.
In FY27, Westgold expects to spend $50 – 75M 2 on exploration and resource definition drilling, with a focus on converting Mineral Resources to Mineral Reserves and providing further organic growth opportunities for the business.
____________________________________ |
3 Refer to the Company's ASX announcement titled "1.1Moz Maiden Fletcher Ore Reserve" dated 18 August 2026 for further information. |
4 Calculated as $42M divided by 1.5Moz of gross Ore Reserve (excludes divestments, depletion and stockpile movements). |
Table 4 and 5 below depicts the FY26 Mineral Reserves statement for the Murchison and Southern Goldfields.
Table 4 – Gold Mineral Reserves at 30 June 2026 for Westgold Operating Mines
Murchison Gold Operations | |||||||||
Mineral Reserve Statement - Rounded for Reporting | |||||||||
As at 30 June 2026 | |||||||||
Proven | Probable | Proven and Probable | |||||||
Operating Mine | Tonnes | Grade | Ounces Au ('000s) | Tonnes | Grade | Ounces Au ('000s) | Tonnes | Grade | Ounces Au ('000s) |
Big Bell UG | 6,329 | 1.72 | 349 | 4,771 | 2.83 | 434 | 11,100 | 2.19 | 783 |
Fender UG | 0 | 0.00 | 0 | 0 | 0.00 | 0 | 0 | 0.00 | 0 |
Great Fingall UG | 28 | 2.55 | 2 | 1,983 | 3.23 | 206 | 2,011 | 3.22 | 208 |
Golden Crown UG | 0 | 0.00 | 0 | 417 | 3.56 | 48 | 417 | 3.56 | 48 |
Bluebird Group UG | 1,195 | 2.37 | 91 | 4,979 | 2.67 | 428 | 6,174 | 2.62 | 519 |
Starlight UG | 2,484 | 2.82 | 225 | 1,285 | 2.39 | 99 | 3,769 | 2.67 | 324 |
Total | 10,035 | 2.07 | 667 | 13,437 | 2.81 | 1,215 | 23,472 | 2.49 | 1,882 |
Southern Goldfields Gold Operations | |||||||||
Mineral Reserve Statement - Rounded for Reporting | |||||||||
As at 30 June 2026 | |||||||||
Proven | Probable | Proven and Probable | |||||||
Operating Mine | Tonnes | Grade | Ounces Au | Tonnes | Grade | Ounces Au | Tonnes | Grade | Ounces Au ('000s) |
Beta Hunt | 2,167 | 1.79 | 125 | 19,506 | 2.41 | 1,509 | 21,674 | 2.34 | 1,634 |
Total | 2,167 | 1.79 | 125 | 19,506 | 2.41 | 1,509 | 21,674 | 2.34 | 1,634 |
Table 5 – Gold Mineral Reserves at 30 June 2026 for Westgold Non-Operating Projects
Non-operating Murchison projects | ||||||||||
Mineral Reserve Statement - Rounded for Reporting | ||||||||||
As at 30 June 2026 | ||||||||||
Proven | Probable | Proven and Probable | ||||||||
Project | Tonnes ('000s) | Grade | Ounces Au ('000s) | Tonnes ('000s) | Grade | Ounces Au ('000s) | Tonnes ('000s) | Grade | Ounces Au ('000s) | |
Big Bell District | 124 | 2.07 | 8 | 0 | 0.00 | 0 | 124 | 2.07 | 8 | |
Cuddingwarra | 84 | 1.29 | 3 | 221 | 1.24 | 9 | 305 | 1.25 | 12 | |
Day Dawn District | 0 | 0.00 | 0 | 14 | 1.83 | 1 | 14 | 1.83 | 1 | |
Tuckabianna | 0 | 0.00 | 0 | 591 | 2.24 | 43 | 591 | 2.24 | 43 | |
Tuckabianna Stockpiles | 87 | 2.16 | 6 | 3,760 | 0.70 | 85 | 3,847 | 0.73 | 91 | |
Meekatharra North | 0 | 0.00 | 0 | 0 | 0.00 | 0 | 0 | 0.00 | 0 | |
Nannine | 0 | 0.00 | 0 | 761 | 1.28 | 31 | 761 | 1.28 | 31 | |
Paddy's Flat | 48 | 4.10 | 6 | 435 | 3.86 | 54 | 483 | 3.88 | 60 | |
Yaloginda District | 0 | 0.00 | 0 | 240 | 1.34 | 10 | 240 | 1.34 | 10 | |
Bluebird Stockpiles | 137 | 2.89 | 13 | 29 | 0.91 | 1 | 167 | 2.54 | 14 | |
Fortnum District | 0 | 0.00 | 0 | 1,217 | 1.49 | 58 | 1,217 | 1.49 | 58 | |
Horseshoe | 0 | 0.00 | 0 | 391 | 1.91 | 24 | 391 | 1.91 | 24 | |
FGO Stockpiles | 290 | 1.28 | 12 | 390 | 0.67 | 8 | 680 | 0.93 | 20 | |
Total | 771 | 1.97 | 49 | 8,050 | 1.25 | 324 | 8,820 | 1.32 | 373 | |
Non-operating Southern Goldfields projects | ||||||||||
Mineral Reserve Statement - Rounded for Reporting | ||||||||||
As at 30 June 2026 | ||||||||||
Proven | Probable | Proven and Probable | ||||||||
Project | Tonnes ('000s) | Grade | Ounces Au ('000s) | Tonnes ('000s) | Grade | Ounces Au ('000s) | Tonnes ('000s) | Grade | Ounces Au ('000s) | |
HGO Central | 132 | 2.19 | 9 | 503 | 3.02 | 49 | 635 | 2.84 | 58 | |
HGO Greater | 0 | 0.00 | 0 | 609 | 4.07 | 80 | 609 | 4.07 | 80 | |
HGO Stockpiles | 1,391 | 0.79 | 35 | 275 | 0.74 | 6 | 1,665 | 0.78 | 42 | |
BHO Stockpiles | 0 | 0.00 | 0 | 0 | 0.00 | 0 | 0 | 0.00 | 0 | |
Total | 1,523 | 0.91 | 45 | 1,386 | 3.03 | 135 | 2,909 | 1.92 | 179 | |
Mineral Reserves are a subset of Measured and Indicated Mineral Resources only. All active open pit and underground operations were depleted to 30 June 2026, based on a data cut-off date of 31 March 2026.
Mineral Reserves have been generated from design studies at a Pre-Feasibility or Feasibility stage, using appropriate cost, geotechnical, slope angle, stope span, dilution, cut-off grade, mining recovery and metallurgical recovery parameters specific to each mine.
Mining methods applied are resource-specific and based on experience with similar orebodies. Deswik™ underground mining software, together with GEOVIA Whittle™ and GEOVIA Surpac™ open pit mining software, was used to create mine designs. A maximum gold price of $4,800/oz has been used to establish Mineral Reserves and determine appropriate cut-off grades.
Mining, milling and additional overhead costs are based on currently contracted and budgeted operating costs. Mill recoveries for all ore types are based on operating experience or metallurgical test work. Mineral Reserves consider environmental, tenement, government and infrastructure approvals, together with transportation requirements to market.
Stockpiles consist of ROM stocks and low-grade stocks mined by Westgold and accumulated by previous owners.
Material year-on-year changes to Westgold's gold Mineral Reserves include (see Figure 12 ):
Background to the Mineral Reserve
All Mineral Reserve inventories are based on detailed three-dimensional designs to ensure practical mining conditions are met. In addition, all Mineral Reserve inventories are above the mine-specific cut-off grades (COGs), contain only Measured and Indicated material, and incorporate the application of Modifying Factors.
Depending on the mining method, Modifying Factors are used to address hydrological, geotechnical, minimum width and blasting conditions. These factors are applied during the stope design process to ensure they are captured before scheduling and are relevant to the style of mineralisation, lithology and ground conditions encountered.
Cost modelling is completed for all deposits within the Mineral Reserve. For operating mines, costs are derived from actual and budgeted rates. For deposits under feasibility assessment, the costs applied are determined from a schedule of rates relevant to the mining method and expected production rates.
Open Pit Methodology
Mineral Reserves are based on pit designs, with appropriate modifications to the original pit shell outlines to ensure compliance with practical mining parameters.
Geotechnical parameters aligned with the open pit Mineral Reserves are based either on observations from existing pit geometries or on domain-specific expectations and assumptions. Various geotechnical reports and retrospective reconciliations are considered when determining design parameters.
Ore dilution through the mining process has been accounted for within the Mineral Reserve inventory. These ratios represent the style of mineralisation and mining method applied during mine planning. These Modifying Factors are determined from various lithological, geotechnical and hydrogeological data.
Minimum mining widths have been accounted for in the designs, with the use of 40t or 90t trucking parameters depending on the size of the pit excavation.
No specific ground support requirements are required beyond suitable pit slope design criteria based on specific geotechnical domains.
The mining sequence is included in the mine scheduling process used for economic evaluation and considers available operating time, equipment size and equipment performance.
No Inferred material is included within the open pit statement, although Inferred material is present in some pit shapes. In these situations, the Inferred material is classified as waste.
Underground Methodology
All underground Mineral Reserves are based on three-dimensional design strings and polygon-derived stope shapes, following the Measured and Indicated Mineral Resource Estimates in areas above the mine operating cut-off grade. A complete mine schedule is then derived from this design to create a Life of Mine plan and financial analysis.
Mining heights and widths are based on first principles and standardised mining methods widely used throughout Western Australia and those already employed at the operating mines.
Geotechnical evaluations have been used to determine stope dimensions, backfilling methodologies, mine sequencing and fundamental geotechnical parameters. Associated costs have been included in the study and budgeting frameworks.
In large, disseminated orebodies, sub-level caving, sub-level open stoping or single-level bench stoping production methods are used. In narrow-vein, laminated quartz-hosted domains, a conservative narrow-bench mining method is used. In narrow, flat-dipping deposits, flat long-hole mining is adopted, with footwall fillets used to account for the rill angle, and/or jumbo stoping.
Stope shape parameters are based on historical data, where available, or expected stable hydraulic radius dimensions derived from first-principles geotechnical data.
Modifying Factors, such as but not limited to minimum mining widths, dilution and ore recovery, are relevant to the style of mineralisation, ground conditions and, where appropriate, historical information.
Stope shape dimensions vary between mining methods. Hydraulic radii are applied to each method and are derived either from historical production or from geotechnical reports and recommendations. Where no data or exposure is available, conservative hydraulic radius values are used based on the contact domain type.
The mining sequence is included in the mine scheduling process used for economic evaluation and considers available operating time, equipment size and equipment performance.
Figures 13 – 17 below depict Life of Mine schematics for Westgold's key operating mines.
Additional detailed information relating to generation of the Mineral Reserves is attached in AppendixA Table 1 – JORC 2012 Reporting Criteria.
Looking Forward
Westgold plans to invest $50–75M2 in exploration and resource development in FY27, subject to operational priorities, market conditions and Board approval. With 26 drill rigs currently active across the portfolio, this investment will maintain the Company's focus on converting Mineral Resources to MineralReserves and extending mine lives across its existing operations.
Near-term resource development will increasingly target opportunities capable of bringing value forward in the operating plan, including potential open-pit sources. In parallel, Westgold will continue to test the medium term potential of its extensive Western Australian portfolio, including opportunities at Big Bell South, Paddy's Flat and Cuddingwarra.
At Beta Hunt, drilling will continue to focus on expanding the Fletcher and Mason mineralised systems, which remain open in multiple directions and represents one of the most significant organic growth opportunities within Westgold's portfolio. Ongoing work is aimed at extending Mineral Resources and Mineral Reserves while improving confidence in the broader Fletcher system and evaluating its potential to support further increases in mining rates.
More broadly, Westgold views continued Mineral Reserve growth as a critical enabler of its long-term strategy to improve processing hub efficiency and maximise returns from existing infrastructure. As Mineral Resources are converted to Mineral Reserves and mine inventories continue to grow, the Company expects to progressively unlock opportunities to increase mining and processing rates across its hubs.
This work will support future mill expansion studies and the ongoing optimisation of hub-scale operating plans, ensuring processing capacity is available to efficiently convert Westgold's growing mineral inventory into sustained production and cash flow.
ThisannouncementisauthorisedforreleasetotheASXbythe Westgold Board.
Competent/Qualified Person Statements
Exploration Results and Mineral Resources Estimates
The information in this release that relates to Exploration results and Mineral Resource Estimates is compiled by Westgold technical employees and contractors under the supervision of Mr. Jake Russell B.Sc. (Hons), who is a member of the Australian Institute of Geoscientists and who has verified, reviewed and approved such information. Mr Russell is a full-time employee of the Company and has sufficient experience which is relevant to the styles of mineralisation and types of deposit under consideration and to the activities which he is undertaking to qualify as a Competent Person as defined in the 2012 Edition of the Australasian Code for Reporting of Exploration Results, Mineral Resources and Mineral Reserves (the "JORC Code") and as a Qualified Person as defined in the CIM Guidelines and National Instrument 43-101 – Standards of Disclosure for Mineral Projects ("NI 43-101"). Mr. Russell is an employee of the Company and, accordingly, is not independent for purposes of NI 43-101. Mr Russell consents to and approves the inclusion in this release of the matters based on his information in the form and context in which it appears. Mr Russell is eligible to participate in short- and long-term incentive plans of the company.
The Mineral Resource Estimates contained herein have an effective date of 30 June 2026 and were completed by Westgold technical employees and contractors under the supervision of Mr Jake Russell. The key inputs and assumptions are provided in Appendix C to this release including Section 1 – Sampling Techniques and Data, Section 2 – Reporting of Exploration Results, Section 3 – Estimation and Reporting of Mineral Resources and Section 4 – Estimation and Reporting of Mineral Reserves.
Mineral Reserves
The information in this release that relates to Mineral Reserves is based on information compiled by Mr. Leigh Devlin B.Eng. FAusIMM, who has verified, reviewed and approved such information. Mr. Devlin has sufficient experience which is relevant to the styles of mineralisation and types of deposit under consideration and to the activities which they are undertaking to qualify as a Competent Person as defined in the JORC Code and as a Qualified Person as defined in the CIM Guidelines and NI 43-101. Mr. Devlin is an employee of the Company and, accordingly, is not independent for purposes of NI 43-101. Mr. Devlin consents to and approves the inclusion in this release of the matters based on his information in the form and context in which it appears. Mr. Devlin is a full-time senior executive of the Company and is eligible to and may participate in short-term and long-term incentive plans of the Company as disclosed in its annual reports and disclosure documents.
General
Mineral Resources, Mineral Reserve Estimates and Exploration Targets and Results are calculated in accordance with the JORC Code. Investors outside Australia should note that while Mineral Reserve and Mineral Resource estimates of the Company in this announcement comply with the JORC Code (such JORC Code-compliant Mineral Reserves and Mineral Resources being " Mineral Reserves" and "Mineral Resources" respectively), they may not comply with the relevant guidelines in other countries. The JORC Code is an acceptable foreign code under NI 43-101. Information contained in this release describing mineral deposits may not be comparable to similar information made public by companies subject to the reporting and disclosure requirements of US securities laws, including Item 1300 of Regulation S-K. All technical and scientific information in this release has been prepared in accordance with the Canadian regulatory requirements set out in NI 43-101 and has been reviewed on behalf of the Company by Qualified Persons, as set forth above.
This release contains references to estimates of Mineral Resources and Mineral Reserves.
The estimation of Mineral Resources is inherently uncertain and involves subjective judgments about many relevant factors. Mineral Resources that are not Mineral Reserves do not have demonstrated economic viability. The accuracy of any such estimates is a function of the quantity and quality of available data, and of the assumptions made and judgments used in engineering and geological interpretation, which may prove to be unreliable and depend, to a certain extent, upon the analysis of drilling results and statistical inferences that may ultimately prove to be inaccurate. Mineral Resource estimates may require re-estimation based on, among other things: (i) fluctuations in the price of gold; (ii) results of drilling; (iii) results of metallurgical testing, process and other studies; (iv) changes to proposed mine plans; (v) the evaluation of mine plans subsequent to the date of any estimates; and (vi) the possible failure to receive required permits, approvals and licenses.
Technical Reports
Westgold has prepared the following NI 43-101 compliant technical reports which support the information contained herein, each of which is available under Westgold's profile on SEDAR+ at www.sedarplus.ca :
Reference should be made to the full text of the foregoing technical reports for the assumptions, qualifications and limitations relating to the Mineral Resource Estimates and Mineral Reserves contained therein and herein.
Forward Looking Statements
These materials prepared by Westgold include forward looking statements. Often, but not always, forward looking statements can generally be identified by the use of forward looking words such as "may", "will", "expect", "intend", "believe", "forecast", "predict", "plan", "estimate", "anticipate", "continue", and "guidance", or other similar words and may include, without limitation, statements regarding plans, strategies and objectives of management, anticipated production or construction commencement dates and expected costs or production outputs.
Forward looking statements inherently involve known and unknown risks, uncertainties and other factors that may cause the Company's actual results, performance and achievements to differ materially from any future results, performance or achievements. Relevant factors may include, but are not limited to, changes in commodity prices, foreign exchange fluctuations and general economic conditions, increased costs and demand for production inputs, the speculative nature of exploration and project development, including the risks of obtaining necessary licenses and permits and diminishing quantities or grades of reserves, political and social risks, changes to the regulatory framework within which the Company operates or may in the future operate, environmental conditions including extreme weather conditions, recruitment and retention of personnel, industrial relations issues and litigation.
Forward looking statements are based on the Company and its management's good faith assumptions relating to the financial, market, regulatory and other relevant environments that will exist and affect the Company's business and operations in the future. The Company does not give any assurance that the assumptions on which forward looking statements are based will prove to be correct, or that the Company's business or operations will not be affected in any material manner by these or other factors not foreseen or foreseeable by the Company or management or beyond the Company's control.
Although the Company attempts and has attempted to identify factors that would cause actual actions, events or results to differ materially from those disclosed in forward looking statements, there may be other factors that could cause actual results, performance, achievements or events not to be as anticipated, estimated or intended, and many events are beyond the reasonable control of the Company. In addition, the Company's actual results could differ materially from those anticipated in these forward looking statements as a result of the factors outlined in the "Risk Factors" section of the Company's continuous disclosure filings available on SEDAR+ or the ASX, including, in the Company's current annual report, half year report or most recent management discussion and analysis.
Accordingly, readers are cautioned not to place undue reliance on forward looking statements. Forward looking statements in these materials speak only at the date of issue. Subject to any continuing obligations under applicable law or any relevant stock exchange listing rules, in providing this information the Company does not undertake any obligation to publicly update or revise any of the forward-looking statements or to advise of any change in events, conditions or circumstances.
Appendix A – JORC 2012 Table 1– Gold Division
SECTION 1: SAMPLING TECHNIQUES AND DATA
(Criteria in this section apply to all succeeding sections.)
Criteria | JORC Code Explanation | Commentary |
Sampling techniques |
|
|
Drilling techniques | ||
Drill sample recovery | ||
Logging |
|
|
Sub-sampling techniques and sample preparation |
|
|
Quality of assay data and laboratory tests |
|
|
Verification of sampling and assaying |
|
|
Location of data points |
|
|
Data spacing and distribution |
|
|
Orientation of data in relation to geological structure |
|
|
Sample security |
|
|
Audits or reviews |
|
|
SECTION 2: REPORTING OF EXPLORATION RESULTS
(Criteria listed in the preceding section also apply to this section.)
Criteria | JORC Code Explanation | Commentary |
Mineral tenement and land tenure status |
|
|
Exploration done by other parties |
|
|
Geology |
| BHO
|
CGO
| ||
FGO
| ||
HGO
| ||
MGO
| ||
Drill hole Information |
|
|
Data aggregation methods |
|
|
Relationship between mineralisation widths and intercept lengths |
|
|
Diagrams |
|
|
Balanced reporting |
|
|
Other substantive exploration data |
|
|
Further work |
|
|
SECTION 3: ESTIMATION AND REPORTING OF MINERAL RESOURCES
(Criteria listed in section 1, and where relevant in section 2, also apply to this section.)
Criteria | JORC Code Explanation | Commentary |
Database integrity |
|
|
Site visits |
|
|
Geological interpretation |
|
|
Dimensions |
| BHO
CGO
FGO
HGO
MGO
STOCKPILES
|
Estimation and modelling techniques. |
|
Datashed – front end to a SQL Database, Leapfrog - Drill hole validation, structural analysis and stereonets, material type, lithology, alteration and faulting wireframes, domaining and mineralisation wireframes, geophysics and regional geology. Snowden Supervisor - geostatistics, variography, declustering, top-cut, kriging neighbourhood analysis (KNA), model validation. Surpac - drill hole validation, block modelling, geostatistics, CIK, OK estimation, block model validation, classification, depletion and reporting.
|
Moisture |
|
|
Cut-off parameters |
|
|
Mining factors or assumptions |
|
|
Metallurgical factors or assumptions |
|
|
Environmental factors or assumptions |
|
|
Bulk density |
|
|
Classification |
|
|
Audits or reviews |
|
|
Discussion of relative accuracy/confidence |
|
|
SECTION 4: ESTIMATION AND REPORTING OF MINERAL RESERVES
(Criteria listed in section 1, and where relevant in sections 2 and 3, also apply to this section.)
Criteria | JORC Code Explanation | Commentary |
Mineral Resource estimate for conversion to Mineral Reserves |
|
|
Site visits |
|
|
Study status |
|
|
Cut-off parameters |
|
|
Mining factors or assumptions |
|
Open Pit Methodology
|
Underground Methodology
| ||
Metallurgical factors or assumptions |
| BHO
CGO
|
FGO
HGO
MGO
| ||
Environmental |
| BHO
CGO
FGO
HGO
MGO
|
| ||
Infrastructure |
| BHO
CGO
FGO
HGO
MGO
|
Costs |
| BHO
CGO
FGO
HGO
MGO
|
Revenue factors |
|
|
Market assessment |
|
|
Economic |
|
|
Social |
| BHO
CGO
FGO
HGO
MGO
|
Other |
|
|
Classification |
|
|
Audits or reviews |
|
|
Discussion of relative accuracy/ confidence |
|
|
Appendix B – JORC 2012 Table 1– Nickel Division
SECTION 1: SAMPLING TECHNIQUES AND DATA
(Criteria in this section apply to all succeeding sections.)
Criteria | JORC Code Explanation | Commentary |
Sampling techniques |
|
|
Drilling techniques |
|
|
Drill sample recovery |
|
|
Logging |
|
|
Sub-sampling techniques and sample preparation |
|
|
Quality of assay data and laboratory tests |
|
|
Verification of sampling and assaying |
|
|
Location of data points |
|
|
Data spacing and distribution |
|
|
Orientation of data in relation to geological structure |
|
|
Sample security |
|
|
Audits or reviews |
|
|
SECTION 2: REPORTING OF EXPLORATION RESULTS
(Criteria listed in the preceding section also apply to this section.)
Criteria | JORC Code Explanation | Commentary |
Mineral tenement and land tenure status |
|
|
Exploration done by other parties |
|
|
Geology |
|
|
Drill hole Information |
|
|
Data aggregation methods |
|
|
Relationship between mineralisation widths and intercept lengths |
|
|
Diagrams |
|
|
Balanced reporting |
|
|
Other substantive exploration data |
|
|
Further work |
|
|
SECTION 3: ESTIMATION AND REPORTING OF MINERAL RESOURCES
(Criteria listed in section 1, and where relevant in section 2, also apply to this section.)
Criteria | JORC Code Explanation | Commentary |
Database integrity |
|
|
Site visits |
|
|
Geological interpretation |
|
|
Dimensions |
|
|
Estimation and modelling techniques. |
|
|
Moisture |
|
|
Cut-off parameters |
|
|
Mining factors or assumptions |
|
|
Metallurgical factors or assumptions |
|
|
Environmental factors or assumptions |
|
|
Bulk density |
|
|
Classification |
|
|
Audits or reviews |
|
|
Discussion of relative accuracy/ confidence |
|
|
SECTION 4: ESTIMATION AND REPORTING OF MINERAL RESERVES
(Criteria listed in section 1, and where relevant in sections 2 and 3, also apply to this section.)
Criteria | JORC Code Explanation | Commentary |
Mineral Resource estimate for conversion to Mineral Reserves |
|
|
Site visits |
|
|
Study status |
|
|
Cut-off parameters |
|
|
Mining factors or assumptions |
| |
Metallurgical factors or assumptions |
|
|
Environmental |
|
|
Infrastructure |
|
|
Costs |
|
|
Revenue factors |
|
|
Market assessment |
|
|
Economic |
|
|
Social |
|
|
Other |
|
|
Classification |
|
|
Audits or reviews |
|
|
Discussion of relative accuracy/ confidence |
|
|
SOURCE Westgold Resources Limited
Investor
Aktieanalys
Fondernas investeringar
Svensk ekonomi
Volvo Cars jättesatsning
Investor
Aktieanalys
Fondernas investeringar
Svensk ekonomi
Volvo Cars jättesatsning
1 DAG %
Senast

OMX Stockholm 30
−0,82%
(vid stängning)
Munters
Idag, 14:51
Munters: Med en rejäl att-göra-lista
OMX Stockholm 30
1 DAG %
Senast
3 264,33


