SURGE ENERGY INC. ANNOUNCES FOURTH QUARTER AND YEAR END FINANCIAL RESULTS FOR 2025; STRONG 2025 YEAR END RESERVE ADDITIONS; OPERATIONAL UPDATES; AND APPOINTMENT TO THE BOARD OF DIRECTORS
4 mars, 23:39
4 mars, 23:39
Canada NewsWire
CALGARY, AB, March 4, 2026
CALGARY, AB , March 4, 2026 /CNW/ - Surge Energy Inc. ("Surge", "SGY", or the "Company") (TSX: SGY) is pleased to announce its financial and operating results for the quarter and year ended December 31, 2025, and its year end 2025 reserves as independently evaluated by GLJ Ltd. ("GLJ"). Furthermore, Surge is pleased to announce the appointment of Mr. Ryan Gritzfeldt to the Board of Directors, effective March 4, 2026.
Select financial and operating information is outlined below and should be read in conjunction with the Company's audited financial statements and management's discussion and analysis for the three months and the year ended December 31, 2025, available at www.sedarplus.ca and on Surge's website at www.surgeenergy.ca .
2025 HIGHLIGHTS
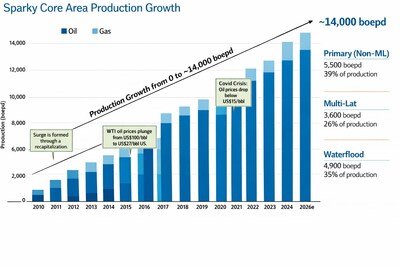
Based on the Company's disciplined capital allocation model, combined with continued strong drilling and waterflood results in Surge's Sparky and SE Saskatchewan core operating areas, the Company exceeded its budgeted production estimates for 2025 by approximately 1,000 boepd, with production averaging 23,491 boepd in 2025 (88% liquids), as compared to Surge's initial 2025 production guidance of 22,500 boepd (91% liquids). The Company exceeded production estimates while spending approximately $10 million less than originally forecasted, with 2025 capital expenditures totaling $159.7 million, compared to initial 2025 capital guidance of $170 million.
In 2025, capital expenditures were reduced by more than $35 million as compared to 2024. This significant improvement in capital efficiencies represents an 18 percent reduction in capital spending year over year, with expenditures on property, plant and equipment of $159.7 million in 2025, decreasing materially from $195.1 million in 2024. Additionally, Surge reduced net operating costs 1 from $20.02 per boe in 2024 to $17.91 per boe in 2025, an 11 percent improvement year over year.
During 2025 West Texas Intermediate ("WTI") crude oil prices decreased by nearly US$11 per barrel, from an average of US$75.72 in 2024 to US$64.77 per barrel in 2025. Despite this significant decrease in oil prices, Surge generated adjusted funds flow ("AFF") 1 of $279.2 million in 2025 ($2.81 per share), and cashflow from operating activities of $266.0 million ($2.68 per share).
As a result of much lower capital spending in 2025, together with lower net operating expenses 1 , Surge generated meaningfully higher free cash flow ("FCF") 1 in 2025 as compared to 2024, despite WTI crude oil prices declining 14 percent (approximately US$11 per barrel). On this basis, the Company generated FCF of $119.5 million in 2025, representing 43 percent of the Company's 2025 AFF of $279.2 million. This compares to FCF of $99 million in 2024, which represented 34 percent of Surge's 2024 AFF of $294.1 million.
In 2025, the Company returned a total of $86.9 million, more than 31 percent of 2025 AFF, to shareholders pursuant to the following:
Surge strategically allocated the majority of remaining FCF to a combination of decommissioning expenditures, cash settlement of dilutive instruments, and small core area "tuck-in" acquisitions.
In 2025, the Company generated its strongest finding and development ("F&D") costs, including changes in future development costs ("FDC"), in the past three years. Surge delivered a 2025 Total Proved & Probable ("TPP") F&D of $14.87/boe, which provided a 2.4x recycle ratio 2 based on a 2025 operating netback 1 (before realized gains on commodity and FX contracts) of $36.23/boe. These results illustrate the strength of Surge's ongoing drilling and waterflood programs.
In 2025, the Company achieved a 136 percent TPP reserves replacement 2 ratio and reported a TPP reserve life index2 of 11.4 years. Furthermore, the Company reported a TPP Net Asset Value ("NAV") 2 of $13.06 per share, based on Surge's December 31, 2025 independent reserve report.
FOURTH QUARTER AND YEAR END 2025 FINANCIAL AND OPERATIONAL HIGHLIGHTS
FINANCIAL AND OPERATING HIGHLIGHTS
FINANCIAL AND OPERATING HIGHLIGHTS | Three Months Ended December 31, | Years Ended December 31, | ||||
($000s except per share and per boe) | 2025 | 2024 | % Change | 2025 | 2024 | % Change |
Financial highlights | ||||||
Oil sales | 121,211 | 158,405 | (23) % | 556,350 | 635,618 | (12) % |
NGL sales | 2,493 | 3,378 | (26) % | 8,042 | 14,218 | (43) % |
Natural gas sales | 2,677 | 1,389 | 93 % | 7,227 | 6,867 | 5 % |
Total oil, natural gas, and NGL revenue | 126,381 | 163,172 | (23) % | 571,619 | 656,703 | (13) % |
Cash flow from operating activities | 59,697 | 64,838 | (8) % | 265,903 | 278,647 | (5) % |
Per share - basic ($) | 0.60 | 0.64 | (6) % | 2.68 | 2.76 | (3) % |
Per share - diluted ($) | 0.59 | 0.64 | (8) % | 2.64 | 2.72 | (3) % |
Adjusted funds flow a | 56,242 | 76,121 | (26) % | 279,155 | 294,123 | (5) % |
Per share - basic ($) a | 0.57 | 0.75 | (24) % | 2.81 | 2.92 | (4) % |
Per share - diluted ($) | 0.55 | 0.75 | (27) % | 2.77 | 2.87 | (3) % |
Net income (loss) b | (7,093) | (2,656) | nm c | 40,259 | (53,716) | nm |
Per share - basic ($) | (0.07) | (0.03) | nm | 0.41 | (0.53) | nm |
Per share - diluted ($) d | (0.07) | (0.03) | nm | 0.40 | (0.53) | nm |
Expenditures on property, plant and equipment | 41,672 | 58,277 | (28) % | 159,706 | 195,103 | (18) % |
Net acquisitions and dispositions | — | (8,868) | nm | 5,661 | (42,389) | nm |
Net capital expenditures | 41,672 | 49,409 | (16) % | 165,367 | 152,714 | 8 % |
Net debt a , end of period | 220,569 | 247,126 | (11) % | 220,569 | 247,126 | (11) % |
Operating highlights | ||||||
Production: | ||||||
Oil (bbls per day) | 19,746 | 20,675 | (4) % | 20,241 | 20,228 | — % |
NGLs (bbls per day) | 673 | 777 | (13) % | 522 | 818 | (36) % |
Natural gas (mcf per day) | 16,599 | 17,199 | (3) % | 16,366 | 18,672 | (12) % |
Total (boe per day) (6:1) | 23,186 | 24,319 | (5) % | 23,491 | 24,158 | (3) % |
Average realized price (excluding hedges): | ||||||
Oil ($ per bbl) | 66.72 | 83.28 | (20) % | 75.30 | 85.85 | (12) % |
NGL ($ per bbl) | 40.29 | 47.26 | (15) % | 42.25 | 47.49 | (11) % |
Natural gas ($ per mcf) | 1.75 | 0.88 | 99 % | 1.21 | 1.00 | 21 % |
Netback ($ per boe) | ||||||
Petroleum and natural gas revenue | 59.25 | 72.93 | (19) % | 66.67 | 74.27 | (10) % |
Realized gain (loss) on commodity and FX contracts | 1.36 | (0.12) | nm | 1.64 | (0.40) | nm |
Royalties | (9.82) | (13.27) | (26) % | (11.52) | (13.56) | (15) % |
Net operating expenses a | (18.09) | (19.12) | (5) % | (17.91) | (20.02) | (11) % |
Transportation expenses | (1.05) | (1.39) | (24) % | (1.04) | (1.29) | (19) % |
Operating netback a | 31.65 | 39.03 | (19) % | 37.84 | 39.00 | (3) % |
G&A expense | (2.60) | (2.33) | 12 % | (2.58) | (2.34) | 10 % |
Interest expense | (2.68) | (2.68) | — % | (2.72) | (3.40) | (20) % |
Adjusted funds flow a | 26.37 | 34.02 | (22) % | 32.54 | 33.26 | (2) % |
Common shares outstanding, end of period | 98,877 | 100,382 | (1) % | 98,877 | 100,382 | (1) % |
Weighted average basic shares outstanding | 98,947 | 101,142 | (2) % | 99,321 | 100,832 | (1) % |
Stock-based compensation dilution d | 2,594 | 745 | 248 % | 1,590 | 1,568 | 1 % |
Weighted average diluted shares outstanding | 101,541 | 101,887 | — % | 100,911 | 102,400 | (1) % |
a This is a non-GAAP and other financial measure which is defined in Non-GAAP and Other Financial Measures. | ||||||
b The twelve months ended December 31, 2024 includes a non-cash impairment charge of $96.5 million. | ||||||
c The Company views this change calculation as not meaningful, or "nm". | ||||||
d Dilution is not reflected in the calculation of net loss for the three months ended December 31, 2025 and for the three months and year ended December 31, 2024. |
OPERATIONS UPDATE
2025 Operations Overview
In 2025, Surge successfully drilled a total of 58 gross (48.8 net) wells, spending a total of $159.7 million, including expenditures on facilities, equipment, land, and capitalized G&A. Drilling operations were focused on the Company's premium medium and light gravity crude oil assets in the Sparky and SE Saskatchewan core areas, where 29 gross (29 net) and 28 gross (18.8 net) wells were drilled, respectively.
In 2025, Surge drilled 17 gross (17 net) multi-lateral wells utilizing the application of modern open hole drilling technology in its Sparky core area, all of which were drilled at the Company's Hope Valley property.
At Surge's 100 percent owned and operated Hope Valley play, the Company continues to experience better than anticipated well results from its modern open hole multi-lateral ("OHML") drilling techniques. Surge drilled 17 gross (17 net) OHML wells at Hope Valley in 2025, with average IP90 production rates of 197 bopd. These results are 22 percent better than the Company's independent reserve auditor IP90 Proved Undeveloped type curve expectations of 162 bopd. Surge successfully drilled and brought on production 6 gross (6.0 net) wells in Hope Valley in Q4/25.
As at December 31, 2025, 53 percent of the Company's current production is supported by legacy vertical waterfloods, horizontal waterfloods, and natural aquifer support, which help to maintain Surge's low (internally estimated) 25 percent corporate decline 2 . Surge has significantly increased the Company's horizontal waterflood program, from seven injector conversions in 2024, to 14 conversions in 2025, based on the continued success of its Sparky, Lloyd, Ratcliffe, Slave Point, and Midale waterfloods. In 2H/25, Surge drilled the Company's first waterflood injector to initiate secondary recovery at Surge's Hope Valley discovery, with the goal of increasing estimated ultimate recoveries from this large Sparky (Mannville) crude oil discovery. The Company has five more dedicated injectors planned for Hope Valley in 2026.
Additionally, over the past 15 months the Company has drilled 20 gross (20 net) single lateral multi-frac wells in the Sparky core area where Surge has successfully implemented high-density frac technology. This approach has doubled the number of frac stages per 1,400m lateral; increasing from 26 stages per well, to 52 stages per well. This strategic modification to Surge's frac design has resulted in a 50 percent increase in IP90 average production rates 4 as compared to Surge's previous single lateral Sparky wells, for a modest additional cost increase of approximately 15 percent ($0.3 million per well).
Surge's 2025 SE Saskatchewan drilling program focused primarily on the Frobisher formation, with a total of 28 gross (18.8 net) wells drilled. This included the use of modern OHML drilling techniques, with 9 gross (7.5 net) wells drilled as stacked multi-lateral wells, each consisting of two to three open-hole legs. Additionally, the program included 1 gross (1 net) single-leg Frobisher well and 1 gross (0.5 net) Frobisher re-entry. Over the last three years, Surge has achieved industry leading results with average 90 day production rates of 195 bopd for all Frobisher wells drilled in the Province of Saskatchewan between January 1, 2022 and December 31, 2025 3 .
In 2025, Surge drilled two (1.8 net) 8 leg OHML wells in the Frobisher 'State A' formation. The second of these drills had an average 90 day production rate of 175 bopd. Surge internally estimates 23 gross (17.2 net) future State A drilling locations, and 9 gross (8.5 net) of these were booked by GLJ in the YE2025 Reserve Report.
A 4 leg multi-lateral well (0.8 net) was drilled in the Oungre / Ratcliffe formation at Surge's Freda waterflooded Lake property. This well came on production in late December and had a 30 day peak production rate of 325 bopd. Surge internally estimates 9 gross (8.5 net) offsetting drilling locations, with 4 gross (4 net) of these booked by GLJ in the YE2025 Reserve Report.
2026 Operations Update
Surge's 2026 capital program remains focused in the Company's Sparky and SE Saskatchewan core areas, with over 95 percent of the 2025 drilling budget allocated to these two areas. A total of 60 gross (54.5 net) wells are planned in 2026, with 31 gross (31.0 net) wells planned in Sparky, and 29 gross (23.5 net) wells planned in SE Saskatchewan.
Sparky (Mannville)
Surge's 2026 capital program in the Sparky core area (>85 percent liquids; 22° API average crude oil gravity) is focused on development drilling, consisting of 10 gross (10.0 net) single-leg fracked Sparky horizontal wells, 16 gross (16.0 net) multi-leg Mannville stack wells, and 5 gross (5.0 net) dedicated single leg injectors. In 2026, Management will be focused on the continued growth of Surge's multilateral well footprint in the Mannville stack of formations, with approximately two thirds of drilling capital directed to multilateral development.
Surge views the Nipisi Clearwater development as a strong technical analog for its Hope Valley Sparky development. With the success of the waterflood in the Clearwater development, Surge plans to accelerate the waterflood at Hope Valley with the drilling of 5 gross (5.0 net) dedicated single-lateral injectors in 2026.
SE Saskatchewan
In the Company's SE Saskatchewan core area, Surge is currently budgeting the drilling of 29 gross (23.5 net) conventional Mississippian horizontal wells, with 25 gross (19.5 net) of these wells targeting the Frobisher light oil formation, and 4.0 gross (4.0 net) targeting the Midale and Lodgepole formations.
Over the past four years, the Company has strategically endeavored to optimize reservoir contact by drilling two and three leg vertically stacked multi-lateral wells within the Frobisher formation. In 2026, 20 gross (15.0 net wells) of Surge's planned 25 gross (19.5 net) Frobisher wells (77 percent) will be drilled as multi-lateral horizontal wells.
2025 YEAR END RESERVES HIGHLIGHTS
Surge is pleased to announce the results of the independent reserves evaluation of the Company's crude oil and natural gas assets, dated February 20, 2026 and effective December 31, 2025, in compliance with National Instrument 51-101 - Standards of Disclosure for Oil and Gas Activities ("NI 51-101") and in accordance with the Canadian Oil and Gas Evaluation Handbook (the "Reserve Report").
Building on the successful 2025 drilling program in the Sparky and SE Saskatchewan core areas, Surge continued to delineate and improve the Company's reserve base through in-fill drilling, pool extensions, incremental waterflood bookings, and new exploration/appraisal drilling throughout the year. Surge delivered its strongest F&D costs in three years, despite a significant decrease in the WTI price used in the Reserves Report.
With Surge's December 31, 2025 Reserve Report, the Company delivered the following:
2025 YEAR-END RESERVES DETAILS
The Company's reserves were independently evaluated by GLJ in accordance with NI 51-101, effective December 31, 2025. Surge's Annual Information Form (the "AIF") for the year ended December 31, 2025 contains Surge's reserves data and other oil and natural gas information as mandated by NI 51-101.
The following tables summarize Surge's working interest in oil, natural gas liquids and natural gas reserves and the net present values ("NPV") of future net revenue for these reserves (before taxes) using forecast prices and costs as evaluated in the Reserves Report. The evaluation is based on the three consultant's average (GLJ, McDaniel & Associates Consultants Ltd. and Sproule Associates Ltd.) forecast pricing and exchange rates at December 31, 2025 which is available on the GLJ website at www.gljpc.com . All references to reserves in this release are to gross Company reserves, meaning Surge's working interest reserves before deductions of royalties and before consideration of the Company's royalty interests. The amounts in the tables may not add due to rounding.
RESERVES SUMMARY AND NET PRESENT VALUE
Gross Reserves(a) | Crude Oil and NGLs (Mbbl)(b) | Natural
(MMcf)(c) | Oil Equivalent
(Mboe) | Before Tax NPV of Future Net
| |||
5% ($MM) | 10% ($MM) | 15% ($MM) | |||||
Proved: | |||||||
Proved Producing | 34,269 | 22,149 | 37,961 | 650 | 613 | 558 | |
Proved Non-Producing | 1,200 | 1,299 | 1,417 | 24 | 21 | 19 | |
Proved Undeveloped | 25,209 | 14,889 | 27,691 | 457 | 340 | 257 | |
Total Proved | 60,679 | 38,337 | 67,068 | 1,131 | 974 | 833 | |
Probable | 25,200 | 20,629 | 28,638 | 720 | 538 | 421 | |
Total Proved Plus Probable | 85,879 | 58,966 | 95,706 | 1,851 | 1,512 | 1,254 |
a) | Amounts may not add due to rounding. |
b) | Includes light, medium, heavy and natural gas liquids. |
c) | Includes non-associated and natural gas, solution gas and coal bed methane. |
d) | Total ADR (Abandonment, Decommissioning, Reclamation) costs for active and inactive wells, facilities and pipelines is included in the reserves report, as it is best practice as stated in the COGE Handbook. |
FUTURE DEVELOPMENT CAPITAL
Total Proved | Total Proved
| ||
($MM) | ($MM) | ||
2026 | 122 | 160 | |
2027 | 128 | 142 | |
2028 | 129 | 157 | |
2029 | 130 | 176 | |
2030 | 70 | 93 | |
Remaining | 17 | 27 | |
Total (Undiscounted) | 596 | 755 | |
Total (Discounted at 10%) | 480 | 602 |
F&D AND FD&A COSTS
2025 | 3-Year Average | |
F&D Costs, including total change in FDC (a) Proved Developed Producing | $19.77 | $22.58 |
Total Proved | $19.11 | $21.45 |
Total Proved + Probable | $14.87 | $23.66 |
FD&A Costs, including total change in FDC (b) Proved Developed Producing | $18.16 | $24.04 |
Total Proved | $17.66 | $28.92 |
Total Proved + Probable | $13.84 | N/A (c) |
a) | 2025 F&D costs calculated using capital of $160 million plus changes in FDC of +$7 million (TP) and +$14 million (TPP) |
b) | 2025 FD&A costs calculated using capital of $165 million plus changes in FDC of +$15 million (TP) and +$30 million (TPP) |
c) | Not meaningful due to 2025 non-core dispositions; negative 2025 FD&A costs and negative reserve adds (-18 mmboe TPP). |
NET ASSET VALUE
PDP | TP | TPP | ||
Reserve Value NPV10 BT ($mm) | 613 | 974 | 1,512 | |
Net Debt ($mm) | (221) | (221) | (221) | |
Total Net Assets ($mm) | 393 | 754 | 1,292 | |
Basic Shares Outstanding (mm) | 98.9 | 98.9 | 98.9 | |
Estimated NAV per Basic Share ($/share) | 3.97 | 7.62 | 13.06 | |
SUMMARY OF PRICING AND INFLATION RATE ASSUMPTIONS
As at December 31, 2025
Canadian Light | Western Canada | Natural Gas | ||||||||
WTI | Sweet Crude | Select (WCS) Crude | AECO-C | Exchange Rate | ||||||
Cushing, Oklahoma | 40° API | 20.5 API | Spot | |||||||
Forecast (a) | ($US/bbl) | ($Cdn/bbl) | ($Cdn/bbl) | ($Cdn/mmbtu) | ($US/$Cdn) | |||||
Year | 2025 (b) | 2024 (c) | 2025 (b) | 2024 (c) | 2025 (b) | 2024 (c) | 2025 (b) | 2024 (c) | 2025 (b) | 2024 (c) |
Forecast | ||||||||||
2026 | $59.92 | $76.00 | $77.54 | $100.69 | $65.12 | $87.59 | $3.00 | $3.42 | 0.728 | 0.725 |
2027 | $65.10 | $76.00 | $83.60 | $97.33 | $70.43 | $84.67 | $3.30 | $3.31 | 0.737 | 0.750 |
2028 | $70.28 | $77.52 | $90.18 | $99.28 | $76.90 | $86.36 | $3.49 | $3.35 | 0.740 | 0.750 |
2029 | $71.93 | $79.07 | $92.32 | $101.27 | $78.71 | $88.09 | $3.58 | $3.41 | 0.740 | 0.750 |
2030 | $73.37 | $80.65 | $94.17 | $103.29 | $80.29 | $89.85 | $3.65 | $3.48 | 0.740 | 0.750 |
2031 | $74.84 | $82.26 | $96.06 | $105.36 | $81.90 | $91.65 | $3.72 | $3.55 | 0.740 | 0.750 |
2032 | $76.34 | $83.91 | $97.98 | $107.46 | $83.53 | $93.48 | $3.80 | $3.62 | 0.740 | 0.750 |
2033 | $77.87 | $85.59 | $99.93 | $109.61 | $85.20 | $95.35 | $3.88 | $3.69 | 0.740 | 0.750 |
2034 | $79.42 | $87.30 | $101.93 | $111.81 | $86.91 | $97.26 | $3.95 | $3.77 | 0.740 | 0.750 |
2035 | $81.01 | $89.05 | $103.97 | $114.05 | $88.65 | $99.21 | $4.03 | $3.85 | 0.740 | 0.750 |
a) | Prices escalate at two percent after 2035, with the exception of foreign exchange which stays flat. |
b) | Three Consultant Average Price Deck Jan 1, 2026 |
c) | Sproule Price Deck Dec 31, 2024 |
APPOINTMENT OF BOARD MEMBER
Surge is pleased to announce the appointment of Mr. Ryan Gritzfeldt to the Board of Directors, effective March 4, 2025.
Mr. Gritzfeldt is a Professional Engineer and senior energy executive with over 27 years of experience in the Canadian oil and gas industry. Mr. Gritzfeldt most recently served as Chief Operating Officer of Veren Inc. (formerly Crescent Point Energy) until it's combination with another Canadian energy company in May 2025. Prior to this role, he held progressively senior leadership positions across the organization including Vice President, Marketing and Innovation, and Vice President, Engineering and Business Development.
Mr. Gritzfeldt received his Bachelor of Applied Science in Industrial Systems Engineering with a Petroleum Systems Option from the University of Regina in 1998. He is a member of both the Association of Professional Engineers and Geoscientists of Alberta and the Association of Professional Engineers and Geoscientists of Saskatchewan and is a Graduate of the Institute of Corporate Directors.
Surge welcomes Mr. Gritzfeldt to our Board of Directors.
OUTLOOK: PREMIUM ASSET QUALITY DRIVES SUPERIOR RETURNS
Surge's premium, conventional crude oil asset base is now more than 92 percent focused in two of the top four crude oil plays in Canada 5 based on per well payout economics in its Sparky (~14,000 boepd; 85 percent medium gravity oil and liquids) and SE Saskatchewan (~7,200 boepd; 90 percent light oil and liquids) core areas.
In light of ongoing geopolitical uncertainty, pursuant to the Company's ongoing, systematic, hedging program, Surge has been strategically locking in crude oil hedge positions for the balance of 2026 at progressively higher crude oil prices, to protect the Company's 2026 capital program and dividend.
Surge intends to continue to deliver attractive shareholder returns in 2026 and beyond based on the key corporate fundamentals set forth below:
1. This is a non-GAAP and other financial measure which is defined under Non-GAAP and Other Financial Measures. |
2. See Oil & Gas Advisories. |
3. Per GeoScout data for all SE Saskatchewan Frobisher wells with an on-production date from January 1, 2022 to December 31, 2025 and 90 days of production data available. |
4. See Drilling Inventory. |
5. Source: Peters & Co. (January 2026 North American Crude Oil and Natural Gas Plays). |
6. Based on the following pricing assumptions: US$65 WTI, US$12.00 WCS differential, US$4.00 EDM differential, $0.715 CAD/USD FX and $2.95 AECO. |
FORWARD LOOKING STATEMENTS:
This press release contains forward-looking statements. The use of any of the words "anticipate", "continue", "estimate", "expect", "may", "will", "project", "should", "believe" and similar expressions are intended to identify forward-looking statements. These statements involve known and unknown risks, uncertainties and other factors that may cause actual results or events to differ materially from those anticipated in such forward-looking statements.
More particularly, this press release contains statements concerning: Surge's declared focus and primary goals; management's 2026 budgeted average production guidance; crude oil fixed price hedges protecting the Company's 2026 free cash flow profile; share repurchases under the Company's NCIB; the repeatability and consistency of drilling results at Hope Valley and moving this asset the full development phase; increasing estimated ultimate recoveries a the Sparky (Manville) crude oil discovery; Surge's planned 2026 drilling program and focus, including expectations regarding the number of wells to be drilled and the types thereof; Surge's 2026 capital program and focus; Surge's intention to have a dedicated rig drilling multi-lateral wells in Hope Valley for the entire year; Surge's reserves, future net revenue, future development capital and reserve life index; Surge continuing to execute an active drilling program at both the Sparky and SE Saskatchewan core areas during the first half of 2026 and the number of wells to be drilled thereat; expectations regarding Surge's proved and probable reserves estimates and locations; Surge's hedging program and its ability to protect the Company's 2026 capital program and dividend; Surge's continued outlook; Management's belief that Surge is well positioned to continue to deliver attractive shareholder returns; and Management's expectations regarding Surge's 2026 average production, AFF, cash flow from operating activities, dividends, drilling inventory and locations, annual corporate decline rates, tax pools and tax horizon.
The forward-looking statements are based on certain key expectations and assumptions made by Surge, including expectations and assumptions regarding the performance of existing wells and success obtained in drilling new wells; anticipated expenses, cash flow and capital expenditures; the application of regulatory and royalty regimes; prevailing commodity prices and economic conditions; development and completion activities; the performance of new wells; the successful implementation of waterflood programs; the availability of and performance of facilities and pipelines; the geological characteristics of Surge's properties; the successful application of drilling, completion and seismic technology; the determination of decommissioning liabilities; prevailing weather conditions; exchange rates; licensing requirements; the impact of completed facilities on operating costs; the availability and costs of capital, labour and services; and the creditworthiness of industry partners.
Although Surge believes that the expectations and assumptions on which the forward-looking statements are based are reasonable, undue reliance should not be placed on the forward-looking statements because Surge can give no assurance that they will prove to be correct. Since forward-looking statements address future events and conditions, by their very nature they involve inherent risks and uncertainties. Actual results could differ materially from those currently anticipated due to a number of factors and risks. These include, but are not limited to, risks associated with the condition of the global economy, including trade, public health and other geopolitical risks; risks associated with the oil and gas industry in general (e.g. operational risks in development, exploration and production; delays or changes in plans with respect to exploration or development projects or capital expenditures; the uncertainty of reserve estimates; the uncertainty of estimates and projections relating to production, costs and expenses, and health, safety and environmental risks); commodity price and exchange rate fluctuations and constraint in the availability of services, adverse weather or break-up conditions; the imposition or expansion of tariffs imposed by domestic and foreign governments or the imposition of other restrictive trade measures, retaliatory or countermeasures implemented by such governments, including the introduction of regulatory barriers to trade and the potential effect on the demand and/or market price for Surge's products and/or otherwise adversely affects Surge; uncertainties resulting from potential delays or changes in plans with respect to exploration or development projects or capital expenditures; and failure to obtain the continued support of the lenders under Surge's bank line. Certain of these risks are set out in more detail in Surge's AIF dated March 4, 2026 and in Surge's MD&A for the year ended December 31, 2025, both of which have been filed on SEDAR+ and can be accessed at www.sedarplus.ca .
The forward-looking statements contained in this press release are made as of the date hereof and Surge undertakes no obligation to update publicly or revise any forward-looking statements or information, whether as a result of new information, future events or otherwise, unless so required by applicable securities laws.
Oil and Gas Advisories
Barrel of Oil Equivalency
The term "boe" means barrel of oil equivalent on the basis of 1 boe to 6,000 cubic feet of natural gas. Boe may be misleading, particularly if used in isolation. A boe conversion ratio of 1 boe for 6,000 cubic feet of natural gas is based on an energy equivalency conversion method primarily applicable at the burner tip and does not represent a value equivalency at the wellhead. "Boe/d" and "boepd" mean barrel of oil equivalent per day. Bbl means barrel of oil and "bopd" means barrels of oil per day. NGLs means natural gas liquids.
Oil and Gas Metrics
This press release contains certain oil and gas metrics and defined terms which do not have standardized meanings or standard methods of calculation and therefore such measures may not be comparable to similar metrics/terms presented by other issuers and may differ by definition and application. All oil and gas metrics/terms used in this document are defined below:
" Acquisition capital " is a non-GAAP financial measure used in the determination of FD&A costs, which is a non-GAAP ratio. The most directly comparable GAAP measure to acquisition capital is expenditures on acquisitions. For property acquisitions and dispositions, acquisition capital is the net purchase price of assets acquired (and net proceeds of assets disposed). For corporate acquisitions, it is the purchase price (cash and/or shares plus assumed bank debt, if applicable) including any estimated working capital surplus or deficit rather than the amounts allocated to property, plant and equipment for accounting purposes. The following table details the calculation of Acquisition capital for the periods indicated :
Years Ended December 31, | |||
($000s) | 2025 | 2024 | 2023 |
Expenditures on acquisitions | 5,777 | 3,535 | 4,240 |
Less: cash from dispositions | (116) | (45,924) | (2,570) |
Acquisition capital | 5,661 | (42,389) | 1,670 |
" Capital payout " or " payout per well ", is the time period for the operating netback of a well to equate to the individual cost of drilling, completing and equipping the well. Management uses capital payout and payout per well as a measure of capital efficiency of a well to make capital allocation decisions.
" Development capital " is used in the determination of FD&A costs, which is a non-GAAP ratio. Development capital is the Company's expenditures on property, plant, and equipment. Development capital means the aggregate exploration and development costs incurred in the financial year on reserves that are categorized as development.
"Original oil in place (OOIP)" refers to the initial volume of oil present in the reservoir at the time of its formation.
" FDC (Future Development Costs) " is the best estimate of the capital costs required to develop and produce reserves.
" F&D (Finding & Development) Costs including total change in FDC " is calculated as the sum of capital spent in 2025 for development of all properties (excluding those Acquired or Disposed of in 2025) and the change in FDC from YE2024 to YE2025, divided by the sum of all reserve additions other than those from Acquisitions & Dispositions. Management uses F&D as a measure of capital efficiency for organic reserves development.
" Finding, Development and Acquisition (FD&A) Costs including total change in FDC " is the sum of the capital spent in 2025 for development of all properties (including those Acquired or Disposed of in 2025), Acquisition & Divestiture capital, and the change in FDC from YE2024 to YE2025, divided by the sum of all reserve additions including those from Acquisitions & Dispositions. Acquisition and Divestiture capital is a non-GAAP financial measure used as a component of FD&A costs. Management uses FD&A costs as a measure of capital efficiency for organic and acquired reserves development.
" Recycle ratio " is calculated by dividing operating netback per boe by F&D costs for the year. Operating netback per boe is a non-GAAP ratio that uses operating netback, a non-GAAP financial measure, as a component. Acquisition capital, a non-GAAP financial measure, is used as a component of F&D costs. Management uses the recycle ratio to relate the cost of adding reserves to the expected cash flows to be generated.
" Net Asset Value (NAV) " is calculated as reserve value discounted at 10% on a BTax basis, less the Company's net debt, a non-GAAP financial measure, at December 31, 2025 of $220.6 million and is divided by 98.9 million common shares outstanding as at December 31, 2025.
" Reserve Life Index" is calculated as total Company share reserves divided by Surge's estimated average 2026 production (23,000 boepd).
" Reserves Replacement Ratio " is the ratio of reserves booked through acquisitions, dispositions, discoveries, infills, extensions, economic factors, technical revisions, and improved recovery to production for the period.
" Organic Reserves Replacement Ratio " is the reserves replacement ratio excluding the effect of acquisitions and dispositions.
" Decline " is the amount existing production decreases year over year (March to March), without new drilling. GLJ's 2025YE reserves have a PDP decline of 25 percent and a P+PDP decline of 23 percent.
Management uses these oil and gas metrics for its own performance measurements and to provide shareholders with measures to compare our operations over time. Readers are cautioned that the information provided by these metrics, or that can be derived from the metrics presented in this press release, should not be relied upon for investment or other purposes.
Drilling Inventory
This press release discloses drilling locations in two categories: (i) booked locations; and (ii) unbooked locations. Booked locations are proved locations and probable locations derived from an external evaluation using standard practices as prescribed in the Canadian Oil and Gas Evaluations Handbook and account for drilling locations that have associated proved and/or probable reserves, as applicable.
Unbooked locations are internal estimates based on prospective acreage and assumptions as to the number of wells that can be drilled per section based on industry practice and internal review. Unbooked locations do not have attributed reserves or resources. Unbooked locations have been identified by Surge's internal Engineers and Geologists (and have been reviewed by Surge's Qualified Reserve Evaluators) as an estimation of our multi-year drilling activities based on evaluation of applicable geologic, seismic, engineering, production and reserves information. There is no certainty that the Company will drill all unbooked drilling locations and if drilled there is no certainty that such locations will result in additional oil and gas reserves, resources or production. The drilling locations on which the Company actually drills wells will ultimately depend upon the availability of capital, regulatory approvals, seasonal restrictions, oil and natural gas prices, costs, actual drilling results, additional reservoir information that is obtained and other factors. While certain of the unbooked drilling locations have been de-risked by drilling existing wells in relative close proximity to such unbooked drilling locations, the majority of other unbooked drilling locations are farther away from existing wells where Management has less information about the characteristics of the reservoir and therefore there is more uncertainty whether wells will be drilled in such locations and if drilled there is more uncertainty that such wells will result in additional oil and gas reserves, resources or production.
Assuming a January 1, 2026 reference date, the Company will have over >1,000 gross (>900 net) drilling locations identified herein; of these >600 gross (>525 net) are unbooked locations. Of the 361 net booked locations identified herein, 282 net are Proved locations and 78 net are Probable locations based on GLJ's 2025YE reserves. Assuming an average number of net wells drilled per year of 65, Surge's >900 net locations provide 13 years of drilling.
Assuming a January 1, 2026 reference date, the Company will have over >500 gross (>500 net) Sparky Core area drilling locations identified herein; of these >300 gross (>300 net) are unbooked locations. Of the 191 net booked locations identified herein, 142 net are Proved locations and 50 net are Probable locations based on GLJ's 2025YE reserves. Assuming an average number of wells drilled per year of 35, Surge's >500 net locations provide >14 years of drilling.
Assuming a January 1, 2026 reference date, the Company will have over >325 gross (>300 net) SE Saskatchewan drilling locations identified herein; of these >170 gross (>145 net) are unbooked locations. Of the 143 net booked locations identified herein, 115 net are Proved locations and 29 net are Probable locations based on GLJ's 2025YE reserves. Assuming an average number of wells drilled per year of 30, Surge's >300 net locations provide >10 years of drilling.
Assuming a January 1, 2026 reference date, the Company will have over 23 gross (17.2 net) State A Frobisher SE Saskatchewan drilling locations identified herein; of these 14 gross (8.7net) are unbooked locations. Of the 9 net booked locations identified herein, 7 net are Proved locations and 2 net are Probable locations based on GLJ's 2025YE reserves.
Surge's internally used type curves were constructed using a representative, factual and balanced analog data set, as of January 1, 2025. All locations were risked appropriately, and EUR's were measured against OOIP estimates to ensure a reasonable recovery factor was being achieved based on the respective spacing assumption. Other assumptions, such as capital, operating expenses, wellhead offsets, land encumbrances, working interests and NGL yields were all reviewed, updated and accounted for on a well-by-well basis (and reviewed by Surge's Qualified Reserve Evaluators). All type curves fully comply with Part 5.8 of the Companion Policy 51 – 101CP.
Over the past 15 months the Company has successfully implemented high-density frac technology (doubling the stages per well), drilling 20 gross (20 net) single lateral multi-frac wells in the Sparky core area. In Provost, this strategic modification to Surge's frac design has resulted in a >50 percent increase in IP90 average production rates (from 94 bopd to 211 bopd on a 1P basis, and from 118 bopd to 210 bopd on a 2P basis) and a >20 percent increase in average oil EUR bookings (from 82 Mstb to 107 Mstb on a 1P basis, and from 110 Mstb to 148 Mstb on a 2P basis). The cost increase associated with this is approximately 15 percent ($0.3 million per well) in the Company's independent reserve auditor type curve as compared to the standard stage spacing bookings.
Non-GAAP and Other Financial Measures
This press release includes references to non-GAAP and other financial measures used by the Company to evaluate its financial performance, financial position or cash flow. These specified financial measures include capital management measures, non-GAAP financial measures and non-GAAP ratios and are not defined by IFRS and therefore are referred to as non-GAAP and other financial measures. Certain secondary financial measures in this press release are not prescribed by GAAP. These non-GAAP and other financial measures are included because Management uses the information to analyze business performance, cash flow generated from the business, leverage and liquidity, resulting from the Company's principal business activities and it may be useful to investors on the same basis. None of these measures are used to enhance the Company's reported financial performance or position. The non-GAAP and other financial measures do not have a standardized meaning prescribed by IFRS and therefore are unlikely to be comparable to similar measures presented by other issuers. They are common in the reports of other companies but may differ by definition and application. All non-GAAP and other financial measures used in this document are defined below, and as applicable, reconciliations to the most directly comparable GAAP measure for the quarter and year ended December 31, 2025, have been provided to demonstrate the calculation of these measures:
Acquisition Capital, FD&A Costs & Recycle Ratio
Acquisition capital is a non-GAAP financial measure and FD&A costs and recycle ratio are non-GAAP ratios. See "Oil and Gas Advisories".
Adjusted Funds Flow & Adjusted Funds Flow Per Share
Adjusted funds flow is a capital management measure. The Company adjusts cash flow from operating activities in calculating adjusted funds flow for changes in non-cash working capital, decommissioning expenditures, and cash settled transaction and other costs (income). Management believes the timing of collection, payment or incurrence of these items involves a high degree of discretion and as such may not be useful for evaluating Surge's cash flows.
Changes in non-cash working capital are a result of the timing of cash flows related to accounts receivable and accounts payable, which management believes reduces comparability between periods. Management views decommissioning expenditures predominately as a discretionary allocation of capital, with flexibility to determine the size and timing of decommissioning programs to achieve greater capital efficiencies and as such, costs may vary between periods. Transaction and other costs represent expenditures associated with property acquisitions and dispositions, debt restructuring and employee severance costs, which management believes do not reflect the ongoing cash flows of the business, and as such reduces comparability. Each of these expenditures, due to their nature, are not considered principal business activities and vary between periods, which management believes reduces comparability.
Adjusted funds flow per share is a supplementary financial measure, calculated using the same weighted average basic and diluted shares used in calculating income (loss) per share.
The following table reconciles cash flow from operating activities to adjusted funds flow and adjusted funds flow per share:
Three Months Ended December 31, | Years Ended December 31, | |||
($000s except per share) | 2025 | 2024 | 2025 | 2024 |
Cash flow from operating activities | 59,697 | 64,838 | 265,903 | 278,647 |
Change in non-cash working capital | (7,158) | 5,303 | — | (7,191) |
Decommissioning expenditures | 4,463 | 5,535 | 14,099 | 15,175 |
Cash settled transaction and other costs (income) | (760) | 445 | (847) | 7,492 |
Adjusted funds flow | 56,242 | 76,121 | 279,155 | 294,123 |
Per share - basic ($) | 0.57 | 0.75 | 2.81 | 2.92 |
Per share - diluted ($) | 0.55 | 0.75 | 2.77 | 2.87 |
Free Cash Flow
Free cash flow is a non-GAAP financial measure. Free cash flow is calculated as cash flow from operating activities, adjusted for changes in non-cash working capital, decommissioning expenditures, and cash settled transaction and other costs (income), less expenditures on property, plant and equipment. Management uses free cash flow to determine the amount of funds available to the Company for future capital allocation decisions.
Three Months Ended December 31, | Years Ended December 31, | |||
($000s) | 2025 | 2024 | 2025 | 2024 |
Cash flow from operating activities | 59,697 | 64,838 | 265,903 | 278,647 |
Change in non-cash working capital | (7,158) | 5,303 | — | (7,191) |
Decommissioning expenditures | 4,463 | 5,535 | 14,099 | 15,175 |
Cash settled transaction and other costs (income) | (760) | 445 | (847) | 7,492 |
Adjusted funds flow | 56,242 | 76,121 | 279,155 | 294,123 |
Less: expenditures on property, plant and equipment | (41,672) | (58,277) | (159,706) | (195,103) |
Free cash flow | 14,570 | 17,844 | 119,449 | 99,020 |
Net Debt
Net debt is a capital management measure, calculated as bank debt, senior unsecured notes, term debt, plus the liability component of the convertible debentures plus current assets, less current liabilities, however, excluding the fair value of financial contracts, decommissioning obligations, and lease and other obligations. There is no comparable measure in accordance with IFRS for net debt. This metric is used by management to analyze the level of debt in the Company including the impact of working capital, which varies with the timing of settlement of these balances.
($000s) | As at Dec 31, 2025 | As at Sep 30, 2025 | As at Dec 31, 2024 |
Cash | 18,654 | 20,494 | 7,594 |
Accounts receivable | 45,813 | 52,305 | 58,327 |
Prepaid expenses and deposits | 3,176 | 4,572 | 3,233 |
Accounts payable and accrued liabilities | (65,018) | (72,373) | (95,433) |
Dividends payable | (4,286) | (4,289) | (4,350) |
Senior unsecured notes | (171,745) | (171,526) | (170,872) |
Term debt | (5,993) | (5,872) | (6,224) |
Convertible debentures | (41,170) | (40,704) | (39,401) |
Net Debt | (220,569) | (217,393) | (247,126) |
Net Operating Expenses & Net Operating Expenses per boe
Net operating expenses is a non-GAAP financial measure, determined by deducting processing income, primarily generated by processing third party volumes at processing facilities where the Company has an ownership interest. It is common in the industry to earn third party processing revenue on facilities where the entity has a working interest in the infrastructure asset. Under IFRS this source of funds is required to be reported as revenue. However, the Company's principal business is not that of a midstream entity whose activities are dedicated to earning processing and other infrastructure payments. Where the Company has excess capacity at one of its facilities, it will look to process third party volumes as a means to reduce the cost of operating/owning the facility. As such, third party processing revenue is netted against operating costs when analyzed by management. Net operating expenses per boe is a non-GAAP ratio, calculated as net operating expenses divided by total barrels of oil equivalent produced during a specific period of time.
Three Months Ended December 31, | Years Ended December 31, | |||
($000s) | 2025 | 2024 | 2025 | 2024 |
Operating expenses | 40,476 | 44,563 | 161,385 | 185,638 |
Less: processing income | (1,899) | (1,780) | (7,866) | (8,592) |
Net operating expenses | 38,577 | 42,783 | 153,519 | 177,046 |
$ per boe | 18.09 | 19.12 | 17.91 | 20.02 |
Operating Netback, Operating Netback per boe, and Adjusted Funds Flow per boe
Operating netback is a non-GAAP financial measure, calculated as petroleum and natural gas revenue and processing and other income, less royalties, realized gain (loss) on commodity and FX contracts, operating expenses, and transportation expenses. Operating netback per boe is a non-GAAP ratio, calculated as operating netback divided by total barrels of oil equivalent produced during a specific period of time. There is no comparable measure in accordance with IFRS. This metric is used by management to evaluate the Company's ability to generate cash margin on a unit of production basis.
Adjusted funds flow per boe is a non-GAAP ratio, calculated as adjusted funds flow divided by total barrels of oil equivalent produced during a specific period of time.
Operating Netback & Adjusted Funds Flow are Calculated on a per unit basis as follows:
Three Months Ended December 31, | Years Ended December 31, | |||
($000s) | 2025 | 2024 | 2025 | 2024 |
Petroleum and natural gas revenue | 126,381 | 163,172 | 571,619 | 656,703 |
Processing and other income | 1,899 | 1,780 | 7,866 | 8,592 |
Royalties | (20,953) | (29,693) | (98,761) | (119,919) |
Realized gain (loss) on commodity and FX contracts | 2,895 | (264) | 14,089 | (3,493) |
Operating expenses | (40,476) | (44,563) | (161,385) | (185,638) |
Transportation expenses | (2,239) | (3,101) | (8,897) | (11,429) |
Operating netback | 67,507 | 87,331 | 324,531 | 344,816 |
G&A expense | (5,548) | (5,216) | (22,087) | (20,653) |
Interest expense | (5,717) | (5,994) | (23,289) | (30,040) |
Adjusted funds flow | 56,242 | 76,121 | 279,155 | 294,123 |
Barrels of oil equivalent (boe) | 2,133,025 | 2,237,273 | 8,573,934 | 8,841,938 |
Operating netback ($ per boe) | 31.65 | 39.03 | 37.84 | 39.00 |
Adjusted funds flow ($ per boe) | 26.37 | 34.02 | 32.54 | 33.26 |
Neither the TSX nor its Regulation Services Provider (as that term is defined in the policies of the TSX) accepts responsibility for the adequacy or accuracy of this release.

SOURCE Surge Energy Inc.

4 mars, 23:39
Canada NewsWire
CALGARY, AB, March 4, 2026
CALGARY, AB , March 4, 2026 /CNW/ - Surge Energy Inc. ("Surge", "SGY", or the "Company") (TSX: SGY) is pleased to announce its financial and operating results for the quarter and year ended December 31, 2025, and its year end 2025 reserves as independently evaluated by GLJ Ltd. ("GLJ"). Furthermore, Surge is pleased to announce the appointment of Mr. Ryan Gritzfeldt to the Board of Directors, effective March 4, 2026.
Select financial and operating information is outlined below and should be read in conjunction with the Company's audited financial statements and management's discussion and analysis for the three months and the year ended December 31, 2025, available at www.sedarplus.ca and on Surge's website at www.surgeenergy.ca .
2025 HIGHLIGHTS
Based on the Company's disciplined capital allocation model, combined with continued strong drilling and waterflood results in Surge's Sparky and SE Saskatchewan core operating areas, the Company exceeded its budgeted production estimates for 2025 by approximately 1,000 boepd, with production averaging 23,491 boepd in 2025 (88% liquids), as compared to Surge's initial 2025 production guidance of 22,500 boepd (91% liquids). The Company exceeded production estimates while spending approximately $10 million less than originally forecasted, with 2025 capital expenditures totaling $159.7 million, compared to initial 2025 capital guidance of $170 million.
In 2025, capital expenditures were reduced by more than $35 million as compared to 2024. This significant improvement in capital efficiencies represents an 18 percent reduction in capital spending year over year, with expenditures on property, plant and equipment of $159.7 million in 2025, decreasing materially from $195.1 million in 2024. Additionally, Surge reduced net operating costs 1 from $20.02 per boe in 2024 to $17.91 per boe in 2025, an 11 percent improvement year over year.
During 2025 West Texas Intermediate ("WTI") crude oil prices decreased by nearly US$11 per barrel, from an average of US$75.72 in 2024 to US$64.77 per barrel in 2025. Despite this significant decrease in oil prices, Surge generated adjusted funds flow ("AFF") 1 of $279.2 million in 2025 ($2.81 per share), and cashflow from operating activities of $266.0 million ($2.68 per share).
As a result of much lower capital spending in 2025, together with lower net operating expenses 1 , Surge generated meaningfully higher free cash flow ("FCF") 1 in 2025 as compared to 2024, despite WTI crude oil prices declining 14 percent (approximately US$11 per barrel). On this basis, the Company generated FCF of $119.5 million in 2025, representing 43 percent of the Company's 2025 AFF of $279.2 million. This compares to FCF of $99 million in 2024, which represented 34 percent of Surge's 2024 AFF of $294.1 million.
In 2025, the Company returned a total of $86.9 million, more than 31 percent of 2025 AFF, to shareholders pursuant to the following:
Surge strategically allocated the majority of remaining FCF to a combination of decommissioning expenditures, cash settlement of dilutive instruments, and small core area "tuck-in" acquisitions.
In 2025, the Company generated its strongest finding and development ("F&D") costs, including changes in future development costs ("FDC"), in the past three years. Surge delivered a 2025 Total Proved & Probable ("TPP") F&D of $14.87/boe, which provided a 2.4x recycle ratio 2 based on a 2025 operating netback 1 (before realized gains on commodity and FX contracts) of $36.23/boe. These results illustrate the strength of Surge's ongoing drilling and waterflood programs.
In 2025, the Company achieved a 136 percent TPP reserves replacement 2 ratio and reported a TPP reserve life index2 of 11.4 years. Furthermore, the Company reported a TPP Net Asset Value ("NAV") 2 of $13.06 per share, based on Surge's December 31, 2025 independent reserve report.
FOURTH QUARTER AND YEAR END 2025 FINANCIAL AND OPERATIONAL HIGHLIGHTS
FINANCIAL AND OPERATING HIGHLIGHTS
FINANCIAL AND OPERATING HIGHLIGHTS | Three Months Ended December 31, | Years Ended December 31, | ||||
($000s except per share and per boe) | 2025 | 2024 | % Change | 2025 | 2024 | % Change |
Financial highlights | ||||||
Oil sales | 121,211 | 158,405 | (23) % | 556,350 | 635,618 | (12) % |
NGL sales | 2,493 | 3,378 | (26) % | 8,042 | 14,218 | (43) % |
Natural gas sales | 2,677 | 1,389 | 93 % | 7,227 | 6,867 | 5 % |
Total oil, natural gas, and NGL revenue | 126,381 | 163,172 | (23) % | 571,619 | 656,703 | (13) % |
Cash flow from operating activities | 59,697 | 64,838 | (8) % | 265,903 | 278,647 | (5) % |
Per share - basic ($) | 0.60 | 0.64 | (6) % | 2.68 | 2.76 | (3) % |
Per share - diluted ($) | 0.59 | 0.64 | (8) % | 2.64 | 2.72 | (3) % |
Adjusted funds flow a | 56,242 | 76,121 | (26) % | 279,155 | 294,123 | (5) % |
Per share - basic ($) a | 0.57 | 0.75 | (24) % | 2.81 | 2.92 | (4) % |
Per share - diluted ($) | 0.55 | 0.75 | (27) % | 2.77 | 2.87 | (3) % |
Net income (loss) b | (7,093) | (2,656) | nm c | 40,259 | (53,716) | nm |
Per share - basic ($) | (0.07) | (0.03) | nm | 0.41 | (0.53) | nm |
Per share - diluted ($) d | (0.07) | (0.03) | nm | 0.40 | (0.53) | nm |
Expenditures on property, plant and equipment | 41,672 | 58,277 | (28) % | 159,706 | 195,103 | (18) % |
Net acquisitions and dispositions | — | (8,868) | nm | 5,661 | (42,389) | nm |
Net capital expenditures | 41,672 | 49,409 | (16) % | 165,367 | 152,714 | 8 % |
Net debt a , end of period | 220,569 | 247,126 | (11) % | 220,569 | 247,126 | (11) % |
Operating highlights | ||||||
Production: | ||||||
Oil (bbls per day) | 19,746 | 20,675 | (4) % | 20,241 | 20,228 | — % |
NGLs (bbls per day) | 673 | 777 | (13) % | 522 | 818 | (36) % |
Natural gas (mcf per day) | 16,599 | 17,199 | (3) % | 16,366 | 18,672 | (12) % |
Total (boe per day) (6:1) | 23,186 | 24,319 | (5) % | 23,491 | 24,158 | (3) % |
Average realized price (excluding hedges): | ||||||
Oil ($ per bbl) | 66.72 | 83.28 | (20) % | 75.30 | 85.85 | (12) % |
NGL ($ per bbl) | 40.29 | 47.26 | (15) % | 42.25 | 47.49 | (11) % |
Natural gas ($ per mcf) | 1.75 | 0.88 | 99 % | 1.21 | 1.00 | 21 % |
Netback ($ per boe) | ||||||
Petroleum and natural gas revenue | 59.25 | 72.93 | (19) % | 66.67 | 74.27 | (10) % |
Realized gain (loss) on commodity and FX contracts | 1.36 | (0.12) | nm | 1.64 | (0.40) | nm |
Royalties | (9.82) | (13.27) | (26) % | (11.52) | (13.56) | (15) % |
Net operating expenses a | (18.09) | (19.12) | (5) % | (17.91) | (20.02) | (11) % |
Transportation expenses | (1.05) | (1.39) | (24) % | (1.04) | (1.29) | (19) % |
Operating netback a | 31.65 | 39.03 | (19) % | 37.84 | 39.00 | (3) % |
G&A expense | (2.60) | (2.33) | 12 % | (2.58) | (2.34) | 10 % |
Interest expense | (2.68) | (2.68) | — % | (2.72) | (3.40) | (20) % |
Adjusted funds flow a | 26.37 | 34.02 | (22) % | 32.54 | 33.26 | (2) % |
Common shares outstanding, end of period | 98,877 | 100,382 | (1) % | 98,877 | 100,382 | (1) % |
Weighted average basic shares outstanding | 98,947 | 101,142 | (2) % | 99,321 | 100,832 | (1) % |
Stock-based compensation dilution d | 2,594 | 745 | 248 % | 1,590 | 1,568 | 1 % |
Weighted average diluted shares outstanding | 101,541 | 101,887 | — % | 100,911 | 102,400 | (1) % |
a This is a non-GAAP and other financial measure which is defined in Non-GAAP and Other Financial Measures. | ||||||
b The twelve months ended December 31, 2024 includes a non-cash impairment charge of $96.5 million. | ||||||
c The Company views this change calculation as not meaningful, or "nm". | ||||||
d Dilution is not reflected in the calculation of net loss for the three months ended December 31, 2025 and for the three months and year ended December 31, 2024. |
OPERATIONS UPDATE
2025 Operations Overview
In 2025, Surge successfully drilled a total of 58 gross (48.8 net) wells, spending a total of $159.7 million, including expenditures on facilities, equipment, land, and capitalized G&A. Drilling operations were focused on the Company's premium medium and light gravity crude oil assets in the Sparky and SE Saskatchewan core areas, where 29 gross (29 net) and 28 gross (18.8 net) wells were drilled, respectively.
In 2025, Surge drilled 17 gross (17 net) multi-lateral wells utilizing the application of modern open hole drilling technology in its Sparky core area, all of which were drilled at the Company's Hope Valley property.
At Surge's 100 percent owned and operated Hope Valley play, the Company continues to experience better than anticipated well results from its modern open hole multi-lateral ("OHML") drilling techniques. Surge drilled 17 gross (17 net) OHML wells at Hope Valley in 2025, with average IP90 production rates of 197 bopd. These results are 22 percent better than the Company's independent reserve auditor IP90 Proved Undeveloped type curve expectations of 162 bopd. Surge successfully drilled and brought on production 6 gross (6.0 net) wells in Hope Valley in Q4/25.
As at December 31, 2025, 53 percent of the Company's current production is supported by legacy vertical waterfloods, horizontal waterfloods, and natural aquifer support, which help to maintain Surge's low (internally estimated) 25 percent corporate decline 2 . Surge has significantly increased the Company's horizontal waterflood program, from seven injector conversions in 2024, to 14 conversions in 2025, based on the continued success of its Sparky, Lloyd, Ratcliffe, Slave Point, and Midale waterfloods. In 2H/25, Surge drilled the Company's first waterflood injector to initiate secondary recovery at Surge's Hope Valley discovery, with the goal of increasing estimated ultimate recoveries from this large Sparky (Mannville) crude oil discovery. The Company has five more dedicated injectors planned for Hope Valley in 2026.
Additionally, over the past 15 months the Company has drilled 20 gross (20 net) single lateral multi-frac wells in the Sparky core area where Surge has successfully implemented high-density frac technology. This approach has doubled the number of frac stages per 1,400m lateral; increasing from 26 stages per well, to 52 stages per well. This strategic modification to Surge's frac design has resulted in a 50 percent increase in IP90 average production rates 4 as compared to Surge's previous single lateral Sparky wells, for a modest additional cost increase of approximately 15 percent ($0.3 million per well).
Surge's 2025 SE Saskatchewan drilling program focused primarily on the Frobisher formation, with a total of 28 gross (18.8 net) wells drilled. This included the use of modern OHML drilling techniques, with 9 gross (7.5 net) wells drilled as stacked multi-lateral wells, each consisting of two to three open-hole legs. Additionally, the program included 1 gross (1 net) single-leg Frobisher well and 1 gross (0.5 net) Frobisher re-entry. Over the last three years, Surge has achieved industry leading results with average 90 day production rates of 195 bopd for all Frobisher wells drilled in the Province of Saskatchewan between January 1, 2022 and December 31, 2025 3 .
In 2025, Surge drilled two (1.8 net) 8 leg OHML wells in the Frobisher 'State A' formation. The second of these drills had an average 90 day production rate of 175 bopd. Surge internally estimates 23 gross (17.2 net) future State A drilling locations, and 9 gross (8.5 net) of these were booked by GLJ in the YE2025 Reserve Report.
A 4 leg multi-lateral well (0.8 net) was drilled in the Oungre / Ratcliffe formation at Surge's Freda waterflooded Lake property. This well came on production in late December and had a 30 day peak production rate of 325 bopd. Surge internally estimates 9 gross (8.5 net) offsetting drilling locations, with 4 gross (4 net) of these booked by GLJ in the YE2025 Reserve Report.
2026 Operations Update
Surge's 2026 capital program remains focused in the Company's Sparky and SE Saskatchewan core areas, with over 95 percent of the 2025 drilling budget allocated to these two areas. A total of 60 gross (54.5 net) wells are planned in 2026, with 31 gross (31.0 net) wells planned in Sparky, and 29 gross (23.5 net) wells planned in SE Saskatchewan.
Sparky (Mannville)
Surge's 2026 capital program in the Sparky core area (>85 percent liquids; 22° API average crude oil gravity) is focused on development drilling, consisting of 10 gross (10.0 net) single-leg fracked Sparky horizontal wells, 16 gross (16.0 net) multi-leg Mannville stack wells, and 5 gross (5.0 net) dedicated single leg injectors. In 2026, Management will be focused on the continued growth of Surge's multilateral well footprint in the Mannville stack of formations, with approximately two thirds of drilling capital directed to multilateral development.
Surge views the Nipisi Clearwater development as a strong technical analog for its Hope Valley Sparky development. With the success of the waterflood in the Clearwater development, Surge plans to accelerate the waterflood at Hope Valley with the drilling of 5 gross (5.0 net) dedicated single-lateral injectors in 2026.
SE Saskatchewan
In the Company's SE Saskatchewan core area, Surge is currently budgeting the drilling of 29 gross (23.5 net) conventional Mississippian horizontal wells, with 25 gross (19.5 net) of these wells targeting the Frobisher light oil formation, and 4.0 gross (4.0 net) targeting the Midale and Lodgepole formations.
Over the past four years, the Company has strategically endeavored to optimize reservoir contact by drilling two and three leg vertically stacked multi-lateral wells within the Frobisher formation. In 2026, 20 gross (15.0 net wells) of Surge's planned 25 gross (19.5 net) Frobisher wells (77 percent) will be drilled as multi-lateral horizontal wells.
2025 YEAR END RESERVES HIGHLIGHTS
Surge is pleased to announce the results of the independent reserves evaluation of the Company's crude oil and natural gas assets, dated February 20, 2026 and effective December 31, 2025, in compliance with National Instrument 51-101 - Standards of Disclosure for Oil and Gas Activities ("NI 51-101") and in accordance with the Canadian Oil and Gas Evaluation Handbook (the "Reserve Report").
Building on the successful 2025 drilling program in the Sparky and SE Saskatchewan core areas, Surge continued to delineate and improve the Company's reserve base through in-fill drilling, pool extensions, incremental waterflood bookings, and new exploration/appraisal drilling throughout the year. Surge delivered its strongest F&D costs in three years, despite a significant decrease in the WTI price used in the Reserves Report.
With Surge's December 31, 2025 Reserve Report, the Company delivered the following:
2025 YEAR-END RESERVES DETAILS
The Company's reserves were independently evaluated by GLJ in accordance with NI 51-101, effective December 31, 2025. Surge's Annual Information Form (the "AIF") for the year ended December 31, 2025 contains Surge's reserves data and other oil and natural gas information as mandated by NI 51-101.
The following tables summarize Surge's working interest in oil, natural gas liquids and natural gas reserves and the net present values ("NPV") of future net revenue for these reserves (before taxes) using forecast prices and costs as evaluated in the Reserves Report. The evaluation is based on the three consultant's average (GLJ, McDaniel & Associates Consultants Ltd. and Sproule Associates Ltd.) forecast pricing and exchange rates at December 31, 2025 which is available on the GLJ website at www.gljpc.com . All references to reserves in this release are to gross Company reserves, meaning Surge's working interest reserves before deductions of royalties and before consideration of the Company's royalty interests. The amounts in the tables may not add due to rounding.
RESERVES SUMMARY AND NET PRESENT VALUE
Gross Reserves(a) | Crude Oil and NGLs (Mbbl)(b) | Natural
(MMcf)(c) | Oil Equivalent
(Mboe) | Before Tax NPV of Future Net
| |||
5% ($MM) | 10% ($MM) | 15% ($MM) | |||||
Proved: | |||||||
Proved Producing | 34,269 | 22,149 | 37,961 | 650 | 613 | 558 | |
Proved Non-Producing | 1,200 | 1,299 | 1,417 | 24 | 21 | 19 | |
Proved Undeveloped | 25,209 | 14,889 | 27,691 | 457 | 340 | 257 | |
Total Proved | 60,679 | 38,337 | 67,068 | 1,131 | 974 | 833 | |
Probable | 25,200 | 20,629 | 28,638 | 720 | 538 | 421 | |
Total Proved Plus Probable | 85,879 | 58,966 | 95,706 | 1,851 | 1,512 | 1,254 |
a) | Amounts may not add due to rounding. |
b) | Includes light, medium, heavy and natural gas liquids. |
c) | Includes non-associated and natural gas, solution gas and coal bed methane. |
d) | Total ADR (Abandonment, Decommissioning, Reclamation) costs for active and inactive wells, facilities and pipelines is included in the reserves report, as it is best practice as stated in the COGE Handbook. |
FUTURE DEVELOPMENT CAPITAL
Total Proved | Total Proved
| ||
($MM) | ($MM) | ||
2026 | 122 | 160 | |
2027 | 128 | 142 | |
2028 | 129 | 157 | |
2029 | 130 | 176 | |
2030 | 70 | 93 | |
Remaining | 17 | 27 | |
Total (Undiscounted) | 596 | 755 | |
Total (Discounted at 10%) | 480 | 602 |
F&D AND FD&A COSTS
2025 | 3-Year Average | |
F&D Costs, including total change in FDC (a) Proved Developed Producing | $19.77 | $22.58 |
Total Proved | $19.11 | $21.45 |
Total Proved + Probable | $14.87 | $23.66 |
FD&A Costs, including total change in FDC (b) Proved Developed Producing | $18.16 | $24.04 |
Total Proved | $17.66 | $28.92 |
Total Proved + Probable | $13.84 | N/A (c) |
a) | 2025 F&D costs calculated using capital of $160 million plus changes in FDC of +$7 million (TP) and +$14 million (TPP) |
b) | 2025 FD&A costs calculated using capital of $165 million plus changes in FDC of +$15 million (TP) and +$30 million (TPP) |
c) | Not meaningful due to 2025 non-core dispositions; negative 2025 FD&A costs and negative reserve adds (-18 mmboe TPP). |
NET ASSET VALUE
PDP | TP | TPP | ||
Reserve Value NPV10 BT ($mm) | 613 | 974 | 1,512 | |
Net Debt ($mm) | (221) | (221) | (221) | |
Total Net Assets ($mm) | 393 | 754 | 1,292 | |
Basic Shares Outstanding (mm) | 98.9 | 98.9 | 98.9 | |
Estimated NAV per Basic Share ($/share) | 3.97 | 7.62 | 13.06 | |
SUMMARY OF PRICING AND INFLATION RATE ASSUMPTIONS
As at December 31, 2025
Canadian Light | Western Canada | Natural Gas | ||||||||
WTI | Sweet Crude | Select (WCS) Crude | AECO-C | Exchange Rate | ||||||
Cushing, Oklahoma | 40° API | 20.5 API | Spot | |||||||
Forecast (a) | ($US/bbl) | ($Cdn/bbl) | ($Cdn/bbl) | ($Cdn/mmbtu) | ($US/$Cdn) | |||||
Year | 2025 (b) | 2024 (c) | 2025 (b) | 2024 (c) | 2025 (b) | 2024 (c) | 2025 (b) | 2024 (c) | 2025 (b) | 2024 (c) |
Forecast | ||||||||||
2026 | $59.92 | $76.00 | $77.54 | $100.69 | $65.12 | $87.59 | $3.00 | $3.42 | 0.728 | 0.725 |
2027 | $65.10 | $76.00 | $83.60 | $97.33 | $70.43 | $84.67 | $3.30 | $3.31 | 0.737 | 0.750 |
2028 | $70.28 | $77.52 | $90.18 | $99.28 | $76.90 | $86.36 | $3.49 | $3.35 | 0.740 | 0.750 |
2029 | $71.93 | $79.07 | $92.32 | $101.27 | $78.71 | $88.09 | $3.58 | $3.41 | 0.740 | 0.750 |
2030 | $73.37 | $80.65 | $94.17 | $103.29 | $80.29 | $89.85 | $3.65 | $3.48 | 0.740 | 0.750 |
2031 | $74.84 | $82.26 | $96.06 | $105.36 | $81.90 | $91.65 | $3.72 | $3.55 | 0.740 | 0.750 |
2032 | $76.34 | $83.91 | $97.98 | $107.46 | $83.53 | $93.48 | $3.80 | $3.62 | 0.740 | 0.750 |
2033 | $77.87 | $85.59 | $99.93 | $109.61 | $85.20 | $95.35 | $3.88 | $3.69 | 0.740 | 0.750 |
2034 | $79.42 | $87.30 | $101.93 | $111.81 | $86.91 | $97.26 | $3.95 | $3.77 | 0.740 | 0.750 |
2035 | $81.01 | $89.05 | $103.97 | $114.05 | $88.65 | $99.21 | $4.03 | $3.85 | 0.740 | 0.750 |
a) | Prices escalate at two percent after 2035, with the exception of foreign exchange which stays flat. |
b) | Three Consultant Average Price Deck Jan 1, 2026 |
c) | Sproule Price Deck Dec 31, 2024 |
APPOINTMENT OF BOARD MEMBER
Surge is pleased to announce the appointment of Mr. Ryan Gritzfeldt to the Board of Directors, effective March 4, 2025.
Mr. Gritzfeldt is a Professional Engineer and senior energy executive with over 27 years of experience in the Canadian oil and gas industry. Mr. Gritzfeldt most recently served as Chief Operating Officer of Veren Inc. (formerly Crescent Point Energy) until it's combination with another Canadian energy company in May 2025. Prior to this role, he held progressively senior leadership positions across the organization including Vice President, Marketing and Innovation, and Vice President, Engineering and Business Development.
Mr. Gritzfeldt received his Bachelor of Applied Science in Industrial Systems Engineering with a Petroleum Systems Option from the University of Regina in 1998. He is a member of both the Association of Professional Engineers and Geoscientists of Alberta and the Association of Professional Engineers and Geoscientists of Saskatchewan and is a Graduate of the Institute of Corporate Directors.
Surge welcomes Mr. Gritzfeldt to our Board of Directors.
OUTLOOK: PREMIUM ASSET QUALITY DRIVES SUPERIOR RETURNS
Surge's premium, conventional crude oil asset base is now more than 92 percent focused in two of the top four crude oil plays in Canada 5 based on per well payout economics in its Sparky (~14,000 boepd; 85 percent medium gravity oil and liquids) and SE Saskatchewan (~7,200 boepd; 90 percent light oil and liquids) core areas.
In light of ongoing geopolitical uncertainty, pursuant to the Company's ongoing, systematic, hedging program, Surge has been strategically locking in crude oil hedge positions for the balance of 2026 at progressively higher crude oil prices, to protect the Company's 2026 capital program and dividend.
Surge intends to continue to deliver attractive shareholder returns in 2026 and beyond based on the key corporate fundamentals set forth below:
1. This is a non-GAAP and other financial measure which is defined under Non-GAAP and Other Financial Measures. |
2. See Oil & Gas Advisories. |
3. Per GeoScout data for all SE Saskatchewan Frobisher wells with an on-production date from January 1, 2022 to December 31, 2025 and 90 days of production data available. |
4. See Drilling Inventory. |
5. Source: Peters & Co. (January 2026 North American Crude Oil and Natural Gas Plays). |
6. Based on the following pricing assumptions: US$65 WTI, US$12.00 WCS differential, US$4.00 EDM differential, $0.715 CAD/USD FX and $2.95 AECO. |
FORWARD LOOKING STATEMENTS:
This press release contains forward-looking statements. The use of any of the words "anticipate", "continue", "estimate", "expect", "may", "will", "project", "should", "believe" and similar expressions are intended to identify forward-looking statements. These statements involve known and unknown risks, uncertainties and other factors that may cause actual results or events to differ materially from those anticipated in such forward-looking statements.
More particularly, this press release contains statements concerning: Surge's declared focus and primary goals; management's 2026 budgeted average production guidance; crude oil fixed price hedges protecting the Company's 2026 free cash flow profile; share repurchases under the Company's NCIB; the repeatability and consistency of drilling results at Hope Valley and moving this asset the full development phase; increasing estimated ultimate recoveries a the Sparky (Manville) crude oil discovery; Surge's planned 2026 drilling program and focus, including expectations regarding the number of wells to be drilled and the types thereof; Surge's 2026 capital program and focus; Surge's intention to have a dedicated rig drilling multi-lateral wells in Hope Valley for the entire year; Surge's reserves, future net revenue, future development capital and reserve life index; Surge continuing to execute an active drilling program at both the Sparky and SE Saskatchewan core areas during the first half of 2026 and the number of wells to be drilled thereat; expectations regarding Surge's proved and probable reserves estimates and locations; Surge's hedging program and its ability to protect the Company's 2026 capital program and dividend; Surge's continued outlook; Management's belief that Surge is well positioned to continue to deliver attractive shareholder returns; and Management's expectations regarding Surge's 2026 average production, AFF, cash flow from operating activities, dividends, drilling inventory and locations, annual corporate decline rates, tax pools and tax horizon.
The forward-looking statements are based on certain key expectations and assumptions made by Surge, including expectations and assumptions regarding the performance of existing wells and success obtained in drilling new wells; anticipated expenses, cash flow and capital expenditures; the application of regulatory and royalty regimes; prevailing commodity prices and economic conditions; development and completion activities; the performance of new wells; the successful implementation of waterflood programs; the availability of and performance of facilities and pipelines; the geological characteristics of Surge's properties; the successful application of drilling, completion and seismic technology; the determination of decommissioning liabilities; prevailing weather conditions; exchange rates; licensing requirements; the impact of completed facilities on operating costs; the availability and costs of capital, labour and services; and the creditworthiness of industry partners.
Although Surge believes that the expectations and assumptions on which the forward-looking statements are based are reasonable, undue reliance should not be placed on the forward-looking statements because Surge can give no assurance that they will prove to be correct. Since forward-looking statements address future events and conditions, by their very nature they involve inherent risks and uncertainties. Actual results could differ materially from those currently anticipated due to a number of factors and risks. These include, but are not limited to, risks associated with the condition of the global economy, including trade, public health and other geopolitical risks; risks associated with the oil and gas industry in general (e.g. operational risks in development, exploration and production; delays or changes in plans with respect to exploration or development projects or capital expenditures; the uncertainty of reserve estimates; the uncertainty of estimates and projections relating to production, costs and expenses, and health, safety and environmental risks); commodity price and exchange rate fluctuations and constraint in the availability of services, adverse weather or break-up conditions; the imposition or expansion of tariffs imposed by domestic and foreign governments or the imposition of other restrictive trade measures, retaliatory or countermeasures implemented by such governments, including the introduction of regulatory barriers to trade and the potential effect on the demand and/or market price for Surge's products and/or otherwise adversely affects Surge; uncertainties resulting from potential delays or changes in plans with respect to exploration or development projects or capital expenditures; and failure to obtain the continued support of the lenders under Surge's bank line. Certain of these risks are set out in more detail in Surge's AIF dated March 4, 2026 and in Surge's MD&A for the year ended December 31, 2025, both of which have been filed on SEDAR+ and can be accessed at www.sedarplus.ca .
The forward-looking statements contained in this press release are made as of the date hereof and Surge undertakes no obligation to update publicly or revise any forward-looking statements or information, whether as a result of new information, future events or otherwise, unless so required by applicable securities laws.
Oil and Gas Advisories
Barrel of Oil Equivalency
The term "boe" means barrel of oil equivalent on the basis of 1 boe to 6,000 cubic feet of natural gas. Boe may be misleading, particularly if used in isolation. A boe conversion ratio of 1 boe for 6,000 cubic feet of natural gas is based on an energy equivalency conversion method primarily applicable at the burner tip and does not represent a value equivalency at the wellhead. "Boe/d" and "boepd" mean barrel of oil equivalent per day. Bbl means barrel of oil and "bopd" means barrels of oil per day. NGLs means natural gas liquids.
Oil and Gas Metrics
This press release contains certain oil and gas metrics and defined terms which do not have standardized meanings or standard methods of calculation and therefore such measures may not be comparable to similar metrics/terms presented by other issuers and may differ by definition and application. All oil and gas metrics/terms used in this document are defined below:
" Acquisition capital " is a non-GAAP financial measure used in the determination of FD&A costs, which is a non-GAAP ratio. The most directly comparable GAAP measure to acquisition capital is expenditures on acquisitions. For property acquisitions and dispositions, acquisition capital is the net purchase price of assets acquired (and net proceeds of assets disposed). For corporate acquisitions, it is the purchase price (cash and/or shares plus assumed bank debt, if applicable) including any estimated working capital surplus or deficit rather than the amounts allocated to property, plant and equipment for accounting purposes. The following table details the calculation of Acquisition capital for the periods indicated :
Years Ended December 31, | |||
($000s) | 2025 | 2024 | 2023 |
Expenditures on acquisitions | 5,777 | 3,535 | 4,240 |
Less: cash from dispositions | (116) | (45,924) | (2,570) |
Acquisition capital | 5,661 | (42,389) | 1,670 |
" Capital payout " or " payout per well ", is the time period for the operating netback of a well to equate to the individual cost of drilling, completing and equipping the well. Management uses capital payout and payout per well as a measure of capital efficiency of a well to make capital allocation decisions.
" Development capital " is used in the determination of FD&A costs, which is a non-GAAP ratio. Development capital is the Company's expenditures on property, plant, and equipment. Development capital means the aggregate exploration and development costs incurred in the financial year on reserves that are categorized as development.
"Original oil in place (OOIP)" refers to the initial volume of oil present in the reservoir at the time of its formation.
" FDC (Future Development Costs) " is the best estimate of the capital costs required to develop and produce reserves.
" F&D (Finding & Development) Costs including total change in FDC " is calculated as the sum of capital spent in 2025 for development of all properties (excluding those Acquired or Disposed of in 2025) and the change in FDC from YE2024 to YE2025, divided by the sum of all reserve additions other than those from Acquisitions & Dispositions. Management uses F&D as a measure of capital efficiency for organic reserves development.
" Finding, Development and Acquisition (FD&A) Costs including total change in FDC " is the sum of the capital spent in 2025 for development of all properties (including those Acquired or Disposed of in 2025), Acquisition & Divestiture capital, and the change in FDC from YE2024 to YE2025, divided by the sum of all reserve additions including those from Acquisitions & Dispositions. Acquisition and Divestiture capital is a non-GAAP financial measure used as a component of FD&A costs. Management uses FD&A costs as a measure of capital efficiency for organic and acquired reserves development.
" Recycle ratio " is calculated by dividing operating netback per boe by F&D costs for the year. Operating netback per boe is a non-GAAP ratio that uses operating netback, a non-GAAP financial measure, as a component. Acquisition capital, a non-GAAP financial measure, is used as a component of F&D costs. Management uses the recycle ratio to relate the cost of adding reserves to the expected cash flows to be generated.
" Net Asset Value (NAV) " is calculated as reserve value discounted at 10% on a BTax basis, less the Company's net debt, a non-GAAP financial measure, at December 31, 2025 of $220.6 million and is divided by 98.9 million common shares outstanding as at December 31, 2025.
" Reserve Life Index" is calculated as total Company share reserves divided by Surge's estimated average 2026 production (23,000 boepd).
" Reserves Replacement Ratio " is the ratio of reserves booked through acquisitions, dispositions, discoveries, infills, extensions, economic factors, technical revisions, and improved recovery to production for the period.
" Organic Reserves Replacement Ratio " is the reserves replacement ratio excluding the effect of acquisitions and dispositions.
" Decline " is the amount existing production decreases year over year (March to March), without new drilling. GLJ's 2025YE reserves have a PDP decline of 25 percent and a P+PDP decline of 23 percent.
Management uses these oil and gas metrics for its own performance measurements and to provide shareholders with measures to compare our operations over time. Readers are cautioned that the information provided by these metrics, or that can be derived from the metrics presented in this press release, should not be relied upon for investment or other purposes.
Drilling Inventory
This press release discloses drilling locations in two categories: (i) booked locations; and (ii) unbooked locations. Booked locations are proved locations and probable locations derived from an external evaluation using standard practices as prescribed in the Canadian Oil and Gas Evaluations Handbook and account for drilling locations that have associated proved and/or probable reserves, as applicable.
Unbooked locations are internal estimates based on prospective acreage and assumptions as to the number of wells that can be drilled per section based on industry practice and internal review. Unbooked locations do not have attributed reserves or resources. Unbooked locations have been identified by Surge's internal Engineers and Geologists (and have been reviewed by Surge's Qualified Reserve Evaluators) as an estimation of our multi-year drilling activities based on evaluation of applicable geologic, seismic, engineering, production and reserves information. There is no certainty that the Company will drill all unbooked drilling locations and if drilled there is no certainty that such locations will result in additional oil and gas reserves, resources or production. The drilling locations on which the Company actually drills wells will ultimately depend upon the availability of capital, regulatory approvals, seasonal restrictions, oil and natural gas prices, costs, actual drilling results, additional reservoir information that is obtained and other factors. While certain of the unbooked drilling locations have been de-risked by drilling existing wells in relative close proximity to such unbooked drilling locations, the majority of other unbooked drilling locations are farther away from existing wells where Management has less information about the characteristics of the reservoir and therefore there is more uncertainty whether wells will be drilled in such locations and if drilled there is more uncertainty that such wells will result in additional oil and gas reserves, resources or production.
Assuming a January 1, 2026 reference date, the Company will have over >1,000 gross (>900 net) drilling locations identified herein; of these >600 gross (>525 net) are unbooked locations. Of the 361 net booked locations identified herein, 282 net are Proved locations and 78 net are Probable locations based on GLJ's 2025YE reserves. Assuming an average number of net wells drilled per year of 65, Surge's >900 net locations provide 13 years of drilling.
Assuming a January 1, 2026 reference date, the Company will have over >500 gross (>500 net) Sparky Core area drilling locations identified herein; of these >300 gross (>300 net) are unbooked locations. Of the 191 net booked locations identified herein, 142 net are Proved locations and 50 net are Probable locations based on GLJ's 2025YE reserves. Assuming an average number of wells drilled per year of 35, Surge's >500 net locations provide >14 years of drilling.
Assuming a January 1, 2026 reference date, the Company will have over >325 gross (>300 net) SE Saskatchewan drilling locations identified herein; of these >170 gross (>145 net) are unbooked locations. Of the 143 net booked locations identified herein, 115 net are Proved locations and 29 net are Probable locations based on GLJ's 2025YE reserves. Assuming an average number of wells drilled per year of 30, Surge's >300 net locations provide >10 years of drilling.
Assuming a January 1, 2026 reference date, the Company will have over 23 gross (17.2 net) State A Frobisher SE Saskatchewan drilling locations identified herein; of these 14 gross (8.7net) are unbooked locations. Of the 9 net booked locations identified herein, 7 net are Proved locations and 2 net are Probable locations based on GLJ's 2025YE reserves.
Surge's internally used type curves were constructed using a representative, factual and balanced analog data set, as of January 1, 2025. All locations were risked appropriately, and EUR's were measured against OOIP estimates to ensure a reasonable recovery factor was being achieved based on the respective spacing assumption. Other assumptions, such as capital, operating expenses, wellhead offsets, land encumbrances, working interests and NGL yields were all reviewed, updated and accounted for on a well-by-well basis (and reviewed by Surge's Qualified Reserve Evaluators). All type curves fully comply with Part 5.8 of the Companion Policy 51 – 101CP.
Over the past 15 months the Company has successfully implemented high-density frac technology (doubling the stages per well), drilling 20 gross (20 net) single lateral multi-frac wells in the Sparky core area. In Provost, this strategic modification to Surge's frac design has resulted in a >50 percent increase in IP90 average production rates (from 94 bopd to 211 bopd on a 1P basis, and from 118 bopd to 210 bopd on a 2P basis) and a >20 percent increase in average oil EUR bookings (from 82 Mstb to 107 Mstb on a 1P basis, and from 110 Mstb to 148 Mstb on a 2P basis). The cost increase associated with this is approximately 15 percent ($0.3 million per well) in the Company's independent reserve auditor type curve as compared to the standard stage spacing bookings.
Non-GAAP and Other Financial Measures
This press release includes references to non-GAAP and other financial measures used by the Company to evaluate its financial performance, financial position or cash flow. These specified financial measures include capital management measures, non-GAAP financial measures and non-GAAP ratios and are not defined by IFRS and therefore are referred to as non-GAAP and other financial measures. Certain secondary financial measures in this press release are not prescribed by GAAP. These non-GAAP and other financial measures are included because Management uses the information to analyze business performance, cash flow generated from the business, leverage and liquidity, resulting from the Company's principal business activities and it may be useful to investors on the same basis. None of these measures are used to enhance the Company's reported financial performance or position. The non-GAAP and other financial measures do not have a standardized meaning prescribed by IFRS and therefore are unlikely to be comparable to similar measures presented by other issuers. They are common in the reports of other companies but may differ by definition and application. All non-GAAP and other financial measures used in this document are defined below, and as applicable, reconciliations to the most directly comparable GAAP measure for the quarter and year ended December 31, 2025, have been provided to demonstrate the calculation of these measures:
Acquisition Capital, FD&A Costs & Recycle Ratio
Acquisition capital is a non-GAAP financial measure and FD&A costs and recycle ratio are non-GAAP ratios. See "Oil and Gas Advisories".
Adjusted Funds Flow & Adjusted Funds Flow Per Share
Adjusted funds flow is a capital management measure. The Company adjusts cash flow from operating activities in calculating adjusted funds flow for changes in non-cash working capital, decommissioning expenditures, and cash settled transaction and other costs (income). Management believes the timing of collection, payment or incurrence of these items involves a high degree of discretion and as such may not be useful for evaluating Surge's cash flows.
Changes in non-cash working capital are a result of the timing of cash flows related to accounts receivable and accounts payable, which management believes reduces comparability between periods. Management views decommissioning expenditures predominately as a discretionary allocation of capital, with flexibility to determine the size and timing of decommissioning programs to achieve greater capital efficiencies and as such, costs may vary between periods. Transaction and other costs represent expenditures associated with property acquisitions and dispositions, debt restructuring and employee severance costs, which management believes do not reflect the ongoing cash flows of the business, and as such reduces comparability. Each of these expenditures, due to their nature, are not considered principal business activities and vary between periods, which management believes reduces comparability.
Adjusted funds flow per share is a supplementary financial measure, calculated using the same weighted average basic and diluted shares used in calculating income (loss) per share.
The following table reconciles cash flow from operating activities to adjusted funds flow and adjusted funds flow per share:
Three Months Ended December 31, | Years Ended December 31, | |||
($000s except per share) | 2025 | 2024 | 2025 | 2024 |
Cash flow from operating activities | 59,697 | 64,838 | 265,903 | 278,647 |
Change in non-cash working capital | (7,158) | 5,303 | — | (7,191) |
Decommissioning expenditures | 4,463 | 5,535 | 14,099 | 15,175 |
Cash settled transaction and other costs (income) | (760) | 445 | (847) | 7,492 |
Adjusted funds flow | 56,242 | 76,121 | 279,155 | 294,123 |
Per share - basic ($) | 0.57 | 0.75 | 2.81 | 2.92 |
Per share - diluted ($) | 0.55 | 0.75 | 2.77 | 2.87 |
Free Cash Flow
Free cash flow is a non-GAAP financial measure. Free cash flow is calculated as cash flow from operating activities, adjusted for changes in non-cash working capital, decommissioning expenditures, and cash settled transaction and other costs (income), less expenditures on property, plant and equipment. Management uses free cash flow to determine the amount of funds available to the Company for future capital allocation decisions.
Three Months Ended December 31, | Years Ended December 31, | |||
($000s) | 2025 | 2024 | 2025 | 2024 |
Cash flow from operating activities | 59,697 | 64,838 | 265,903 | 278,647 |
Change in non-cash working capital | (7,158) | 5,303 | — | (7,191) |
Decommissioning expenditures | 4,463 | 5,535 | 14,099 | 15,175 |
Cash settled transaction and other costs (income) | (760) | 445 | (847) | 7,492 |
Adjusted funds flow | 56,242 | 76,121 | 279,155 | 294,123 |
Less: expenditures on property, plant and equipment | (41,672) | (58,277) | (159,706) | (195,103) |
Free cash flow | 14,570 | 17,844 | 119,449 | 99,020 |
Net Debt
Net debt is a capital management measure, calculated as bank debt, senior unsecured notes, term debt, plus the liability component of the convertible debentures plus current assets, less current liabilities, however, excluding the fair value of financial contracts, decommissioning obligations, and lease and other obligations. There is no comparable measure in accordance with IFRS for net debt. This metric is used by management to analyze the level of debt in the Company including the impact of working capital, which varies with the timing of settlement of these balances.
($000s) | As at Dec 31, 2025 | As at Sep 30, 2025 | As at Dec 31, 2024 |
Cash | 18,654 | 20,494 | 7,594 |
Accounts receivable | 45,813 | 52,305 | 58,327 |
Prepaid expenses and deposits | 3,176 | 4,572 | 3,233 |
Accounts payable and accrued liabilities | (65,018) | (72,373) | (95,433) |
Dividends payable | (4,286) | (4,289) | (4,350) |
Senior unsecured notes | (171,745) | (171,526) | (170,872) |
Term debt | (5,993) | (5,872) | (6,224) |
Convertible debentures | (41,170) | (40,704) | (39,401) |
Net Debt | (220,569) | (217,393) | (247,126) |
Net Operating Expenses & Net Operating Expenses per boe
Net operating expenses is a non-GAAP financial measure, determined by deducting processing income, primarily generated by processing third party volumes at processing facilities where the Company has an ownership interest. It is common in the industry to earn third party processing revenue on facilities where the entity has a working interest in the infrastructure asset. Under IFRS this source of funds is required to be reported as revenue. However, the Company's principal business is not that of a midstream entity whose activities are dedicated to earning processing and other infrastructure payments. Where the Company has excess capacity at one of its facilities, it will look to process third party volumes as a means to reduce the cost of operating/owning the facility. As such, third party processing revenue is netted against operating costs when analyzed by management. Net operating expenses per boe is a non-GAAP ratio, calculated as net operating expenses divided by total barrels of oil equivalent produced during a specific period of time.
Three Months Ended December 31, | Years Ended December 31, | |||
($000s) | 2025 | 2024 | 2025 | 2024 |
Operating expenses | 40,476 | 44,563 | 161,385 | 185,638 |
Less: processing income | (1,899) | (1,780) | (7,866) | (8,592) |
Net operating expenses | 38,577 | 42,783 | 153,519 | 177,046 |
$ per boe | 18.09 | 19.12 | 17.91 | 20.02 |
Operating Netback, Operating Netback per boe, and Adjusted Funds Flow per boe
Operating netback is a non-GAAP financial measure, calculated as petroleum and natural gas revenue and processing and other income, less royalties, realized gain (loss) on commodity and FX contracts, operating expenses, and transportation expenses. Operating netback per boe is a non-GAAP ratio, calculated as operating netback divided by total barrels of oil equivalent produced during a specific period of time. There is no comparable measure in accordance with IFRS. This metric is used by management to evaluate the Company's ability to generate cash margin on a unit of production basis.
Adjusted funds flow per boe is a non-GAAP ratio, calculated as adjusted funds flow divided by total barrels of oil equivalent produced during a specific period of time.
Operating Netback & Adjusted Funds Flow are Calculated on a per unit basis as follows:
Three Months Ended December 31, | Years Ended December 31, | |||
($000s) | 2025 | 2024 | 2025 | 2024 |
Petroleum and natural gas revenue | 126,381 | 163,172 | 571,619 | 656,703 |
Processing and other income | 1,899 | 1,780 | 7,866 | 8,592 |
Royalties | (20,953) | (29,693) | (98,761) | (119,919) |
Realized gain (loss) on commodity and FX contracts | 2,895 | (264) | 14,089 | (3,493) |
Operating expenses | (40,476) | (44,563) | (161,385) | (185,638) |
Transportation expenses | (2,239) | (3,101) | (8,897) | (11,429) |
Operating netback | 67,507 | 87,331 | 324,531 | 344,816 |
G&A expense | (5,548) | (5,216) | (22,087) | (20,653) |
Interest expense | (5,717) | (5,994) | (23,289) | (30,040) |
Adjusted funds flow | 56,242 | 76,121 | 279,155 | 294,123 |
Barrels of oil equivalent (boe) | 2,133,025 | 2,237,273 | 8,573,934 | 8,841,938 |
Operating netback ($ per boe) | 31.65 | 39.03 | 37.84 | 39.00 |
Adjusted funds flow ($ per boe) | 26.37 | 34.02 | 32.54 | 33.26 |
Neither the TSX nor its Regulation Services Provider (as that term is defined in the policies of the TSX) accepts responsibility for the adequacy or accuracy of this release.
SOURCE Surge Energy Inc.
Aktieanalys
Rapporter i urval
Aktieköp
Aktieanalys
Rapporter i urval
Aktieköp
1 DAG %
Senast

OMX Stockholm 30
0,39%
(vid stängning)
Stockholmsbörsen
Igår, 17:45
Försiktigt uppåt på börsen
OMX Stockholm 30
1 DAG %
Senast
3 146,34


