Pega’s AI Strategy Powers Continued Acceleration in Q2 2025
22 juli, 22:05
22 juli, 22:05
Pegasystems Inc. (NASDAQ: PEGA), the Enterprise Transformation Company™, released its financial results for the second quarter of 2025.
This press release features multimedia. View the full release here: https://www.businesswire.com/news/home/20250722695089/en/
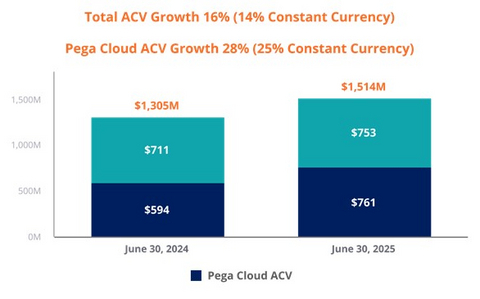
Total ACV Growth and Pega Cloud ACV Growth
“Our unique approach to AI was a key driver of our strong first half results,” said Alan Trefler, Pega founder and CEO. “Pega harnesses AI's creative potential where it can best drive transformation—during workflow design with Pega Blueprint. This drives consistent execution through our state-of-the-art Pega Infinity workflow engine, rather than through inherently unpredictable prompts. Pega’s Predictable AI approach gives enterprises both the innovation they crave and the operational consistency they require.”
“Our first half of 2025 results show what happens when strategy, innovation, and execution come together,” said Pega COO & CFO Ken Stillwell. “Pega Blueprint is a game-changer for AI-driven enterprise transformation. Our disciplined focus on Rule of 40 principles is fueling both accelerated growth and margin expansion. We are more aligned, more energized, and more effective than ever.”
Financial and performance metrics (1)
____________________________ |
1 Refer to the schedules at the end of this release for additional information, including a reconciliation of GAAP and non-GAAP measures. |
Reconciliation of ACV and Constant Currency ACV
(in millions, except percentages) | June 30, 2024 | June 30, 2025 | 1-Year Change | ||||||
ACV | $ | 1,305 | $ | 1,514 | 16 | % | |||
Impact of changes in foreign exchange rates | — | (32 | ) | ||||||
Constant currency ACV | $ | 1,305 | $ | 1,482 | 14 | % | |||
Note: Constant currency ACV is calculated by applying the June 30, 2024 foreign exchange rates to current period shown. |
(Dollars in thousands, | Three Months Ended June 30, | Six Months Ended June 30, | ||||||||||||||||
2025 | 2024 | Change | 2025 | 2024 | Change | |||||||||||||
Total revenue | $ | 384,512 | $ | 351,153 | 9 | % | $ | 860,145 | $ | 681,300 | 26 | % | ||||||
Net income (loss) - GAAP | $ | 30,077 | $ | 6,613 | 355 | % | $ | 115,499 | $ | (5,511 | ) | * | ||||||
Net income - non-GAAP | $ | 50,151 | $ | 45,841 | 9 | % | $ | 190,693 | $ | 87,995 | 117 | % | ||||||
Diluted earnings (loss) per share - GAAP | $ | 0.17 | $ | 0.04 | 325 | % | $ | 0.63 | $ | (0.03 | ) | * | ||||||
Diluted earnings per share - non-GAAP | $ | 0.28 | $ | 0.26 | 8 | % | $ | 1.04 | $ | 0.50 | 108 | % | ||||||
* Not meaningful |
(1) | Per share amounts have been recast for all prior periods to reflect the effect of the Company’s two-for-one forward common stock split effected in the form of a stock dividend distributed on June 20, 2025. |
Three Months Ended June 30, | Six Months Ended June 30, | ||||||||||||||||||||||||||||||
(Dollars in thousands) | 2025 | 2024 | Change | 2025 | 2024 | Change | |||||||||||||||||||||||||
Pega Cloud | $ | 166,743 | 43 | % | $ | 134,086 | 38 | % | $ | 32,657 | 24 | % | $ | 317,866 | 37 | % | $ | 264,988 | 39 | % | $ | 52,878 | 20 | % | |||||||
Maintenance | 79,271 | 21 | % | 80,344 | 23 | % | (1,073 | ) | (1 | )% | 155,639 | 18 | % | 161,345 | 23 | % | (5,706 | ) | (4 | )% | |||||||||||
Subscription services | 246,014 | 64 | % | 214,430 | 61 | % | 31,584 | 15 | % | 473,505 | 55 | % | 426,333 | 62 | % | 47,172 | 11 | % | |||||||||||||
Subscription license | 79,963 | 21 | % | 84,647 | 24 | % | (4,684 | ) | (6 | )% | 266,518 | 31 | % | 147,985 | 22 | % | 118,533 | 80 | % | ||||||||||||
Subscription | 325,977 | 85 | % | 299,077 | 85 | % | 26,900 | 9 | % | 740,023 | 86 | % | 574,318 | 84 | % | 165,705 | 29 | % | |||||||||||||
Consulting | 57,824 | 15 | % | 52,040 | 15 | % | 5,784 | 11 | % | 118,245 | 14 | % | 106,087 | 16 | % | 12,158 | 11 | % | |||||||||||||
Perpetual license | 711 | — | % | 36 | — | % | 675 | 1875 | % | 1,877 | — | % | 895 | — | % | 982 | 110 | % | |||||||||||||
Total revenue | $ | 384,512 | 100 | % | $ | 351,153 | 100 | % | $ | 33,359 | 9 | % | $ | 860,145 | 100 | % | $ | 681,300 | 100 | % | $ | 178,845 | 26 | % |
Quarterly conference call
A conference call and audio-only webcast will be conducted at 8:00 a.m. EDT on Wednesday, July 23, 2025.
Members of the public and investors are invited to join the call and participate in the question and answer session by dialing 1 (800) 715-9871 (domestic) or 1 (646) 307-1963 (international) and using Conference ID 7346894, or via https://events.q4inc.com/attendee/586505740 by logging onto www.pega.com at least five minutes prior to the event's broadcast and clicking on the webcast icon in the Investors section.
Discussion of non-GAAP financial measures
Our non-GAAP financial measures should only be read in conjunction with our consolidated financial statements prepared in accordance with GAAP. We believe that these measures help investors understand our core operating results and prospects, which is consistent with how management measures and forecasts our performance without the effect of often one-time charges and other items outside our normal operations. Management uses these measures to assess the performance of the company's operations and establish operational goals and incentives. They are not a substitute for financial measures prepared under U.S. GAAP. Refer to the schedules at the end of this release for additional information, including a reconciliation of GAAP and non-GAAP measures.
Forward-looking statements
Certain statements in this press release may be "forward-looking statements” as defined in the Private Securities Litigation Reform Act of 1995.
Words such as expects, anticipates, intends, plans, believes, will, could, should, estimates, may, targets, strategies, intends to, projects, forecasts, guidance, likely, and usually or variations of such words and other similar expressions identify forward-looking statements. These statements represent our views only as of the date the statement was made and are based on current expectations and assumptions.
Forward-looking statements deal with future events and are subject to risks and uncertainties that are difficult to predict, including, but not limited to:
These risks and others that may cause actual results to differ materially from those expressed in such forward-looking statements are described further in Part I of our Annual Report on Form 10-K for the year ended December 31, 2024, and other filings we make with the SEC.
Investors are cautioned not to place undue reliance on such forward-looking statements, and there are no assurances that the results included in such statements will be achieved. Although subsequent events may cause our view to change, except as required by applicable law, we do not undertake and expressly disclaim any obligation to publicly update or revise these forward-looking statements, whether as the result of new information, future events, or otherwise.
Any forward-looking statements in this press release represent our views as of July 22, 2025.
About Pegasystems
Pega is The Enterprise Transformation CompanyTM that helps organizations Build for Change® with enterprise AI decisioning and workflow automation. Many of the world’s most influential businesses rely on our platform to solve their most pressing challenges, from personalizing engagement to automating service to streamlining operations. Since 1983, we’ve built our scalable and flexible architecture to help enterprises meet today’s customer demands while continuously transforming for tomorrow. For more information on Pega (NASDAQ: PEGA), www.pega.com.
All trademarks are the property of their respective owners.
PEGASYSTEMS INC. UNAUDITED CONDENSED CONSOLIDATED STATEMENTS OF OPERATIONS (1) (in thousands, except per share amounts) | |||||||||||||||
Three Months Ended June 30, | Six Months Ended June 30, | ||||||||||||||
2025 | 2024 | 2025 | 2024 | ||||||||||||
Revenue | |||||||||||||||
Subscription services | $ | 246,014 | $ | 214,430 | $ | 473,505 | $ | 426,333 | |||||||
Subscription license | 79,963 | 84,647 | 266,518 | 147,985 | |||||||||||
Consulting | 57,824 | 52,040 | 118,245 | 106,087 | |||||||||||
Perpetual license | 711 | 36 | 1,877 | 895 | |||||||||||
Total revenue | 384,512 | 351,153 | 860,145 | 681,300 | |||||||||||
Cost of revenue | |||||||||||||||
Subscription services | 41,510 | 36,238 | 79,638 | 72,062 | |||||||||||
Subscription license | 360 | 477 | 746 | 1,120 | |||||||||||
Consulting | 67,700 | 60,231 | 131,634 | 118,413 | |||||||||||
Perpetual license | 4 | — | 6 | 9 | |||||||||||
Total cost of revenue | 109,574 | 96,946 | 212,024 | 191,604 | |||||||||||
Gross profit | 274,938 | 254,207 | 648,121 | 489,696 | |||||||||||
Operating expenses | |||||||||||||||
Selling and marketing | 147,131 | 139,761 | 285,200 | 267,456 | |||||||||||
Research and development | 78,784 | 75,425 | 153,070 | 147,538 | |||||||||||
General and administrative | 31,788 | 25,420 | 65,616 | 48,947 | |||||||||||
Litigation settlement, net of recoveries | — | — | — | 32,403 | |||||||||||
Restructuring | (44 | ) | 635 | (33 | ) | 798 | |||||||||
Total operating expenses | 257,659 | 241,241 | 503,853 | 497,142 | |||||||||||
Income (loss) from operations | 17,279 | 12,966 | 144,268 | (7,446 | ) | ||||||||||
Foreign currency transaction (loss) gain | (14,008 | ) | 437 | (19,333 | ) | (2,825 | ) | ||||||||
Interest income | 3,248 | 6,785 | 8,583 | 12,066 | |||||||||||
Interest expense | (1 | ) | (1,656 | ) | (1,028 | ) | (3,408 | ) | |||||||
Gain (loss) on capped call transactions | — | (3,277 | ) | (223 | ) | 22 | |||||||||
Other income, net | 18,729 | — | 19,290 | 1,684 | |||||||||||
Income before (benefit from) provision for income taxes | 25,247 | 15,255 | 151,557 | 93 | |||||||||||
(Benefit from) provision for income taxes | (4,830 | ) | 8,642 | 36,058 | 5,604 | ||||||||||
Net income (loss) | $ | 30,077 | $ | 6,613 | $ | 115,499 | $ | (5,511 | ) | ||||||
Earnings (loss) per share | |||||||||||||||
Basic | $ | 0.18 | $ | 0.04 | $ | 0.67 | $ | (0.03 | ) | ||||||
Diluted | $ | 0.17 | $ | 0.04 | $ | 0.63 | $ | (0.03 | ) | ||||||
Weighted-average number of common shares outstanding | |||||||||||||||
Basic | 170,776 | 170,314 | 171,287 | 169,424 | |||||||||||
Diluted | 182,160 | 177,000 | 185,477 | 169,424 |
(1) | The number of common shares and per share amounts have been recast for all prior periods to reflect the effect of the Company’s two-for-one forward common stock split effected in the form of a stock dividend distributed on June 20, 2025. |
PEGASYSTEMS INC. UNAUDITED CONDENSED CONSOLIDATED BALANCE SHEETS (in thousands) | |||||
June 30, 2025 | December 31, 2024 | ||||
Assets | |||||
Current assets: | |||||
Cash and cash equivalents | $ | 201,565 | $ | 337,103 | |
Marketable securities | 210,002 | 402,870 | |||
Total cash, cash equivalents, and marketable securities | 411,567 | 739,973 | |||
Accounts receivable, net | 156,470 | 305,468 | |||
Unbilled receivables, net | 184,184 | 173,085 | |||
Other current assets | 93,403 | 115,178 | |||
Total current assets | 845,624 | 1,333,704 | |||
Long-term unbilled receivables, net | 104,298 | 61,407 | |||
Goodwill | 81,538 | 81,113 | |||
Other long-term assets | 292,957 | 292,049 | |||
Total assets | $ | 1,324,417 | $ | 1,768,273 | |
Liabilities and stockholders’ equity | |||||
Current liabilities: | |||||
Accounts payable | $ | 17,101 | $ | 6,226 | |
Accrued expenses | 51,430 | 31,544 | |||
Accrued compensation and related expenses | 91,769 | 138,042 | |||
Deferred revenue | 418,931 | 423,910 | |||
Convertible senior notes, net | — | 467,470 | |||
Other current liabilities | 20,387 | 18,866 | |||
Total current liabilities | 599,618 | 1,086,058 | |||
Long-term operating lease liabilities | 65,191 | 67,647 | |||
Other long-term liabilities | 35,066 | 29,088 | |||
Total liabilities | 699,875 | 1,182,793 | |||
Total stockholders’ equity | 624,542 | 585,480 | |||
Total liabilities and stockholders’ equity | $ | 1,324,417 | $ | 1,768,273 |
PEGASYSTEMS INC. UNAUDITED CONDENSED CONSOLIDATED STATEMENTS OF CASH FLOWS (in thousands) | |||||||
Six Months Ended June 30, | |||||||
2025 | 2024 | ||||||
Net income (loss) | $ | 115,499 | $ | (5,511 | ) | ||
Adjustments to reconcile net income (loss) to cash provided by operating activities | |||||||
Non-cash items | 123,170 | 116,288 | |||||
Change in operating assets and liabilities, net | 51,827 | 109,466 | |||||
Cash provided by operating activities | 290,496 | 220,243 | |||||
Cash provided by (used in) investing activities | 212,995 | (209,700 | ) | ||||
Cash (used in) provided by financing activities | (646,316 | ) | 22,503 | ||||
Effect of exchange rate changes on cash, cash equivalents, and restricted cash | 7,407 | (2,842 | ) | ||||
Net (decrease) increase in cash, cash equivalents, and restricted cash | (135,418 | ) | 30,204 | ||||
Cash, cash equivalents, and restricted cash, beginning of period | 341,529 | 232,827 | |||||
Cash, cash equivalents, and restricted cash, end of period | $ | 206,111 | $ | 263,031 |
PEGASYSTEMS INC. RECONCILIATION OF SELECTED GAAP AND NON-GAAP MEASURES (1) (in thousands, except percentages and per share amounts) | |||||||||||||||||||||
Three Months Ended June 30, | Six Months Ended June 30, | ||||||||||||||||||||
2025 | 2024 | Change | 2025 | 2024 | Change | ||||||||||||||||
Net income (loss) - GAAP | $ | 30,077 | $ | 6,613 | 355 | % | $ | 115,499 | $ | (5,511 | ) | * | |||||||||
Stock-based compensation (2) | 36,730 | 36,224 | 78,155 | 71,005 | |||||||||||||||||
Restructuring | (44 | ) | 635 | (33 | ) | 798 | |||||||||||||||
Legal fees | 6,409 | 2,409 | 12,953 | 4,351 | |||||||||||||||||
Litigation settlement, net of recoveries | — | — | — | 32,403 | |||||||||||||||||
Amortization of intangible assets | 675 | 789 | 1,376 | 1,753 | |||||||||||||||||
Interest on convertible senior notes | — | 619 | 394 | 1,236 | |||||||||||||||||
Capped call transactions | — | 3,277 | 223 | (22 | ) | ||||||||||||||||
Foreign currency transaction loss (gain) | 14,008 | (437 | ) | 19,333 | 2,825 | ||||||||||||||||
Other | (18,729 | ) | — | (19,480 | ) | (1,628 | ) | ||||||||||||||
Income taxes (3) | (18,975 | ) | (4,288 | ) | (17,727 | ) | (19,215 | ) | |||||||||||||
Net income - non-GAAP | $ | 50,151 | $ | 45,841 | 9 | % | $ | 190,693 | $ | 87,995 | 117 | % | |||||||||
Diluted earnings (loss) per share - GAAP | $ | 0.17 | $ | 0.04 | 325 | % | $ | 0.63 | $ | (0.03 | ) | * | |||||||||
non-GAAP adjustments | 0.11 | 0.22 | 0.41 | 0.53 | |||||||||||||||||
Diluted earnings per share - non-GAAP | $ | 0.28 | $ | 0.26 | 8 | % | $ | 1.04 | $ | 0.50 | 108 | % | |||||||||
Diluted weighted-average number of common shares outstanding - GAAP | 182,160 | 177,000 | 3 | % | 185,477 | 169,424 | 9 | % | |||||||||||||
Capped call transactions | — | — | (2,412 | ) | — | ||||||||||||||||
Stock-based compensation | — | — | — | 6,436 | |||||||||||||||||
Diluted weighted-average number of common shares outstanding - non-GAAP | 182,160 | 177,000 | 3 | % | 183,065 | 175,860 | 4 | % | |||||||||||||
* Not meaningful |
Our non-GAAP financial measures reflect the following adjustments:
(1) | Per share amounts have been recast for all prior periods to reflect the effect of the Company’s two-for-one forward common stock split effected in the form of a stock dividend distributed on June 20, 2025. | |
(2) | Stock-based compensation: |
Three Months Ended June 30, | Six Months Ended June 30, | ||||||||||||||
(Dollars in thousands) | 2025 | 2024 | 2025 | 2024 | |||||||||||
Cost of revenue | $ | 7,288 | $ | 7,092 | $ | 15,111 | $ | 13,664 | |||||||
Selling and marketing | 14,378 | 13,564 | 30,159 | 27,452 | |||||||||||
Research and development | 7,490 | 7,825 | 15,875 | 15,471 | |||||||||||
General and administrative | 7,574 | 7,743 | 17,010 | 14,418 | |||||||||||
$ | 36,730 | $ | 36,224 | $ | 78,155 | $ | 71,005 | ||||||||
Income tax benefit | $ | (566 | ) | $ | (554 | ) | $ | (1,153 | ) | $ | (865 | ) |
(3) | Effective income tax rates: |
Six Months Ended June 30, | |||||
2025 | 2024 | ||||
GAAP | 24 | % | * | ||
non-GAAP | 22 | % | 22 | % | |
* Not meaningful |
Our GAAP effective income tax rate is subject to significant fluctuations due to several factors, including our stock-based compensation plans, research and development tax credits, and the valuation allowance on our deferred tax assets in the U.S. and U.K. We determine our non-GAAP income tax rate using applicable rates in taxing jurisdictions and assessing certain factors, including historical and forecasted earnings by jurisdiction, discrete items, and ability to realize tax assets. We believe it is beneficial for our management to review our non-GAAP results consistent with our annual plan’s effective income tax rate as established at the beginning of each year, given tax rate volatility.
PEGASYSTEMS INC. RECONCILIATION OF FREE CASH FLOW (1) AND OTHER METRICS (in thousands, except percentages) | ||||||||||
Six Months Ended June 30, | Change | |||||||||
2025 | 2024 | |||||||||
Cash provided by operating activities | $ | 290,496 | 220,243 | 32 | % | |||||
Investment in property and equipment | (4,015 | ) | (1,857 | ) | ||||||
Free cash flow (1) | $ | 286,481 | $ | 218,386 | 31 | % | ||||
Supplemental information (2) | ||||||||||
Litigation settlement, net of recoveries | $ | — | $ | 32,403 | ||||||
Legal fees | 10,020 | 2,701 | ||||||||
Restructuring | 1,354 | 3,852 | ||||||||
Interest paid on convertible senior notes | 1,754 | 1,884 | ||||||||
Income taxes, net of refunds | (702 | ) | 25,560 | |||||||
$ | 12,426 | $ | 66,400 |
(1) Our non-GAAP free cash flow is defined as cash provided by operating activities less investment in property and equipment. Investment in property and equipment fluctuates in amount and frequency and is significantly affected by the timing and size of investments in our facilities and equipment. We provide information on free cash flow to enable investors to assess our ability to generate cash without incurring additional external financings. This information is not a substitute for financial measures prepared under U.S. GAAP.
(2) The supplemental information discloses items that affect our cash flows and are considered by management not to be representative of our core business operations and ongoing operational performance.
PEGASYSTEMS INC.
ANNUAL CONTRACT VALUE
(in thousands, except percentages)
Annual contract value (“ACV”) - ACV represents the annualized value of our active contracts as of the measurement date. The contract's total value is divided by its duration in years to calculate ACV. ACV is a performance measure that we believe provides useful information to our management and investors.
June 30, 2025 | June 30, 2024 | Change | Constant Currency Change | |||||||||||
Pega Cloud | $ | 761,051 | $ | 593,752 | $ | 167,299 | 28 | % | 25 | % | ||||
Maintenance | 301,375 | 310,608 | (9,233 | ) | (3 | )% | (5 | )% | ||||||
Subscription services | 1,062,426 | 904,360 | 158,066 | 17 | % | 15 | % | |||||||
Subscription license | 451,591 | 400,949 | 50,642 | 13 | % | 11 | % | |||||||
$ | 1,514,017 | $ | 1,305,309 | $ | 208,708 | 16 | % | 14 | % |
PEGASYSTEMS INC.
BACKLOG
(in thousands, except percentages)
Remaining performance obligations (“Backlog”) - Expected future revenue from existing non-cancellable contracts:
As of June 30, 2025:
Subscription services | Subscription license | Perpetual license | |||||||||||||||||||||||
Pega Cloud | Maintenance | Consulting | Total | ||||||||||||||||||||||
1 year or less | $ | 603,683 | $ | 220,954 | $ | 61,905 | $ | 317 | $ | 39,798 | $ | 926,657 | 51 | % | |||||||||||
1-2 years | 334,586 | 79,345 | 4,262 | — | 2,846 | 421,039 | 23 | % | |||||||||||||||||
2-3 years | 172,513 | 49,587 | 746 | — | 252 | 223,098 | 12 | % | |||||||||||||||||
Greater than 3 years | 210,416 | 46,843 | 7,220 | — | 56 | 264,535 | 14 | % | |||||||||||||||||
$ | 1,321,198 | $ | 396,729 | $ | 74,133 | $ | 317 | $ | 42,952 | $ | 1,835,329 | 100 | % | ||||||||||||
% of Total | 72 | % | 22 | % | 4 | % | — | % | 2 | % | 100 | % | |||||||||||||
Change since June 30, 2024 | |||||||||||||||||||||||||
$ | 306,436 | $ | 75,823 | $ | 37,143 | $ | (2,379 | ) | $ | 12,057 | $ | 429,080 | |||||||||||||
30 | % | 24 | % | 100 | % | (88 | )% | 39 | % | 31 | % |
As of June 30, 2024:
Subscription services | Subscription license | Perpetual license | |||||||||||||||||||||||
Pega Cloud | Maintenance | Consulting | Total | ||||||||||||||||||||||
1 year or less | $ | 470,379 | $ | 209,655 | $ | 23,931 | $ | 2,696 | $ | 25,953 | $ | 732,614 | 52 | % | |||||||||||
1-2 years | 301,070 | 63,266 | 10,078 | — | 2,469 | 376,883 | 27 | % | |||||||||||||||||
2-3 years | 152,839 | 30,032 | 2,884 | — | 2,473 | 188,228 | 13 | % | |||||||||||||||||
Greater than 3 years | 90,474 | 17,953 | 97 | — | — | 108,524 | 8 | % | |||||||||||||||||
$ | 1,014,762 | $ | 320,906 | $ | 36,990 | $ | 2,696 | $ | 30,895 | $ | 1,406,249 | 100 | % | ||||||||||||
% of Total | 72 | % | 23 | % | 3 | % | — | % | 2 | % | 100 | % |
PEGASYSTEMS INC. RECONCILIATION OF GAAP BACKLOG AND CONSTANT CURRENCY BACKLOG (in millions, except percentages) | |||||||||
June 30, 2024 | June 30, 2025 | 1 Year Growth Rate | |||||||
Backlog - GAAP | $ | 1,406 | $ | 1,835 | 31 | % | |||
Impact of changes in foreign exchange rates | — | (55 | ) | ||||||
Constant currency backlog | $ | 1,406 | $ | 1,780 | 27 | % | |||
Note: Constant currency backlog is calculated by applying the June 30, 2024 foreign exchange rates to current period shown. |
View source version on businesswire.com: https://www.businesswire.com/news/home/20250722695089/en/
22 juli, 22:05
Pegasystems Inc. (NASDAQ: PEGA), the Enterprise Transformation Company™, released its financial results for the second quarter of 2025.
This press release features multimedia. View the full release here: https://www.businesswire.com/news/home/20250722695089/en/
Total ACV Growth and Pega Cloud ACV Growth
“Our unique approach to AI was a key driver of our strong first half results,” said Alan Trefler, Pega founder and CEO. “Pega harnesses AI's creative potential where it can best drive transformation—during workflow design with Pega Blueprint. This drives consistent execution through our state-of-the-art Pega Infinity workflow engine, rather than through inherently unpredictable prompts. Pega’s Predictable AI approach gives enterprises both the innovation they crave and the operational consistency they require.”
“Our first half of 2025 results show what happens when strategy, innovation, and execution come together,” said Pega COO & CFO Ken Stillwell. “Pega Blueprint is a game-changer for AI-driven enterprise transformation. Our disciplined focus on Rule of 40 principles is fueling both accelerated growth and margin expansion. We are more aligned, more energized, and more effective than ever.”
Financial and performance metrics (1)
____________________________ |
1 Refer to the schedules at the end of this release for additional information, including a reconciliation of GAAP and non-GAAP measures. |
Reconciliation of ACV and Constant Currency ACV
(in millions, except percentages) | June 30, 2024 | June 30, 2025 | 1-Year Change | ||||||
ACV | $ | 1,305 | $ | 1,514 | 16 | % | |||
Impact of changes in foreign exchange rates | — | (32 | ) | ||||||
Constant currency ACV | $ | 1,305 | $ | 1,482 | 14 | % | |||
Note: Constant currency ACV is calculated by applying the June 30, 2024 foreign exchange rates to current period shown. |
(Dollars in thousands, | Three Months Ended June 30, | Six Months Ended June 30, | ||||||||||||||||
2025 | 2024 | Change | 2025 | 2024 | Change | |||||||||||||
Total revenue | $ | 384,512 | $ | 351,153 | 9 | % | $ | 860,145 | $ | 681,300 | 26 | % | ||||||
Net income (loss) - GAAP | $ | 30,077 | $ | 6,613 | 355 | % | $ | 115,499 | $ | (5,511 | ) | * | ||||||
Net income - non-GAAP | $ | 50,151 | $ | 45,841 | 9 | % | $ | 190,693 | $ | 87,995 | 117 | % | ||||||
Diluted earnings (loss) per share - GAAP | $ | 0.17 | $ | 0.04 | 325 | % | $ | 0.63 | $ | (0.03 | ) | * | ||||||
Diluted earnings per share - non-GAAP | $ | 0.28 | $ | 0.26 | 8 | % | $ | 1.04 | $ | 0.50 | 108 | % | ||||||
* Not meaningful |
(1) | Per share amounts have been recast for all prior periods to reflect the effect of the Company’s two-for-one forward common stock split effected in the form of a stock dividend distributed on June 20, 2025. |
Three Months Ended June 30, | Six Months Ended June 30, | ||||||||||||||||||||||||||||||
(Dollars in thousands) | 2025 | 2024 | Change | 2025 | 2024 | Change | |||||||||||||||||||||||||
Pega Cloud | $ | 166,743 | 43 | % | $ | 134,086 | 38 | % | $ | 32,657 | 24 | % | $ | 317,866 | 37 | % | $ | 264,988 | 39 | % | $ | 52,878 | 20 | % | |||||||
Maintenance | 79,271 | 21 | % | 80,344 | 23 | % | (1,073 | ) | (1 | )% | 155,639 | 18 | % | 161,345 | 23 | % | (5,706 | ) | (4 | )% | |||||||||||
Subscription services | 246,014 | 64 | % | 214,430 | 61 | % | 31,584 | 15 | % | 473,505 | 55 | % | 426,333 | 62 | % | 47,172 | 11 | % | |||||||||||||
Subscription license | 79,963 | 21 | % | 84,647 | 24 | % | (4,684 | ) | (6 | )% | 266,518 | 31 | % | 147,985 | 22 | % | 118,533 | 80 | % | ||||||||||||
Subscription | 325,977 | 85 | % | 299,077 | 85 | % | 26,900 | 9 | % | 740,023 | 86 | % | 574,318 | 84 | % | 165,705 | 29 | % | |||||||||||||
Consulting | 57,824 | 15 | % | 52,040 | 15 | % | 5,784 | 11 | % | 118,245 | 14 | % | 106,087 | 16 | % | 12,158 | 11 | % | |||||||||||||
Perpetual license | 711 | — | % | 36 | — | % | 675 | 1875 | % | 1,877 | — | % | 895 | — | % | 982 | 110 | % | |||||||||||||
Total revenue | $ | 384,512 | 100 | % | $ | 351,153 | 100 | % | $ | 33,359 | 9 | % | $ | 860,145 | 100 | % | $ | 681,300 | 100 | % | $ | 178,845 | 26 | % |
Quarterly conference call
A conference call and audio-only webcast will be conducted at 8:00 a.m. EDT on Wednesday, July 23, 2025.
Members of the public and investors are invited to join the call and participate in the question and answer session by dialing 1 (800) 715-9871 (domestic) or 1 (646) 307-1963 (international) and using Conference ID 7346894, or via https://events.q4inc.com/attendee/586505740 by logging onto www.pega.com at least five minutes prior to the event's broadcast and clicking on the webcast icon in the Investors section.
Discussion of non-GAAP financial measures
Our non-GAAP financial measures should only be read in conjunction with our consolidated financial statements prepared in accordance with GAAP. We believe that these measures help investors understand our core operating results and prospects, which is consistent with how management measures and forecasts our performance without the effect of often one-time charges and other items outside our normal operations. Management uses these measures to assess the performance of the company's operations and establish operational goals and incentives. They are not a substitute for financial measures prepared under U.S. GAAP. Refer to the schedules at the end of this release for additional information, including a reconciliation of GAAP and non-GAAP measures.
Forward-looking statements
Certain statements in this press release may be "forward-looking statements” as defined in the Private Securities Litigation Reform Act of 1995.
Words such as expects, anticipates, intends, plans, believes, will, could, should, estimates, may, targets, strategies, intends to, projects, forecasts, guidance, likely, and usually or variations of such words and other similar expressions identify forward-looking statements. These statements represent our views only as of the date the statement was made and are based on current expectations and assumptions.
Forward-looking statements deal with future events and are subject to risks and uncertainties that are difficult to predict, including, but not limited to:
These risks and others that may cause actual results to differ materially from those expressed in such forward-looking statements are described further in Part I of our Annual Report on Form 10-K for the year ended December 31, 2024, and other filings we make with the SEC.
Investors are cautioned not to place undue reliance on such forward-looking statements, and there are no assurances that the results included in such statements will be achieved. Although subsequent events may cause our view to change, except as required by applicable law, we do not undertake and expressly disclaim any obligation to publicly update or revise these forward-looking statements, whether as the result of new information, future events, or otherwise.
Any forward-looking statements in this press release represent our views as of July 22, 2025.
About Pegasystems
Pega is The Enterprise Transformation CompanyTM that helps organizations Build for Change® with enterprise AI decisioning and workflow automation. Many of the world’s most influential businesses rely on our platform to solve their most pressing challenges, from personalizing engagement to automating service to streamlining operations. Since 1983, we’ve built our scalable and flexible architecture to help enterprises meet today’s customer demands while continuously transforming for tomorrow. For more information on Pega (NASDAQ: PEGA), www.pega.com.
All trademarks are the property of their respective owners.
PEGASYSTEMS INC. UNAUDITED CONDENSED CONSOLIDATED STATEMENTS OF OPERATIONS (1) (in thousands, except per share amounts) | |||||||||||||||
Three Months Ended June 30, | Six Months Ended June 30, | ||||||||||||||
2025 | 2024 | 2025 | 2024 | ||||||||||||
Revenue | |||||||||||||||
Subscription services | $ | 246,014 | $ | 214,430 | $ | 473,505 | $ | 426,333 | |||||||
Subscription license | 79,963 | 84,647 | 266,518 | 147,985 | |||||||||||
Consulting | 57,824 | 52,040 | 118,245 | 106,087 | |||||||||||
Perpetual license | 711 | 36 | 1,877 | 895 | |||||||||||
Total revenue | 384,512 | 351,153 | 860,145 | 681,300 | |||||||||||
Cost of revenue | |||||||||||||||
Subscription services | 41,510 | 36,238 | 79,638 | 72,062 | |||||||||||
Subscription license | 360 | 477 | 746 | 1,120 | |||||||||||
Consulting | 67,700 | 60,231 | 131,634 | 118,413 | |||||||||||
Perpetual license | 4 | — | 6 | 9 | |||||||||||
Total cost of revenue | 109,574 | 96,946 | 212,024 | 191,604 | |||||||||||
Gross profit | 274,938 | 254,207 | 648,121 | 489,696 | |||||||||||
Operating expenses | |||||||||||||||
Selling and marketing | 147,131 | 139,761 | 285,200 | 267,456 | |||||||||||
Research and development | 78,784 | 75,425 | 153,070 | 147,538 | |||||||||||
General and administrative | 31,788 | 25,420 | 65,616 | 48,947 | |||||||||||
Litigation settlement, net of recoveries | — | — | — | 32,403 | |||||||||||
Restructuring | (44 | ) | 635 | (33 | ) | 798 | |||||||||
Total operating expenses | 257,659 | 241,241 | 503,853 | 497,142 | |||||||||||
Income (loss) from operations | 17,279 | 12,966 | 144,268 | (7,446 | ) | ||||||||||
Foreign currency transaction (loss) gain | (14,008 | ) | 437 | (19,333 | ) | (2,825 | ) | ||||||||
Interest income | 3,248 | 6,785 | 8,583 | 12,066 | |||||||||||
Interest expense | (1 | ) | (1,656 | ) | (1,028 | ) | (3,408 | ) | |||||||
Gain (loss) on capped call transactions | — | (3,277 | ) | (223 | ) | 22 | |||||||||
Other income, net | 18,729 | — | 19,290 | 1,684 | |||||||||||
Income before (benefit from) provision for income taxes | 25,247 | 15,255 | 151,557 | 93 | |||||||||||
(Benefit from) provision for income taxes | (4,830 | ) | 8,642 | 36,058 | 5,604 | ||||||||||
Net income (loss) | $ | 30,077 | $ | 6,613 | $ | 115,499 | $ | (5,511 | ) | ||||||
Earnings (loss) per share | |||||||||||||||
Basic | $ | 0.18 | $ | 0.04 | $ | 0.67 | $ | (0.03 | ) | ||||||
Diluted | $ | 0.17 | $ | 0.04 | $ | 0.63 | $ | (0.03 | ) | ||||||
Weighted-average number of common shares outstanding | |||||||||||||||
Basic | 170,776 | 170,314 | 171,287 | 169,424 | |||||||||||
Diluted | 182,160 | 177,000 | 185,477 | 169,424 |
(1) | The number of common shares and per share amounts have been recast for all prior periods to reflect the effect of the Company’s two-for-one forward common stock split effected in the form of a stock dividend distributed on June 20, 2025. |
PEGASYSTEMS INC. UNAUDITED CONDENSED CONSOLIDATED BALANCE SHEETS (in thousands) | |||||
June 30, 2025 | December 31, 2024 | ||||
Assets | |||||
Current assets: | |||||
Cash and cash equivalents | $ | 201,565 | $ | 337,103 | |
Marketable securities | 210,002 | 402,870 | |||
Total cash, cash equivalents, and marketable securities | 411,567 | 739,973 | |||
Accounts receivable, net | 156,470 | 305,468 | |||
Unbilled receivables, net | 184,184 | 173,085 | |||
Other current assets | 93,403 | 115,178 | |||
Total current assets | 845,624 | 1,333,704 | |||
Long-term unbilled receivables, net | 104,298 | 61,407 | |||
Goodwill | 81,538 | 81,113 | |||
Other long-term assets | 292,957 | 292,049 | |||
Total assets | $ | 1,324,417 | $ | 1,768,273 | |
Liabilities and stockholders’ equity | |||||
Current liabilities: | |||||
Accounts payable | $ | 17,101 | $ | 6,226 | |
Accrued expenses | 51,430 | 31,544 | |||
Accrued compensation and related expenses | 91,769 | 138,042 | |||
Deferred revenue | 418,931 | 423,910 | |||
Convertible senior notes, net | — | 467,470 | |||
Other current liabilities | 20,387 | 18,866 | |||
Total current liabilities | 599,618 | 1,086,058 | |||
Long-term operating lease liabilities | 65,191 | 67,647 | |||
Other long-term liabilities | 35,066 | 29,088 | |||
Total liabilities | 699,875 | 1,182,793 | |||
Total stockholders’ equity | 624,542 | 585,480 | |||
Total liabilities and stockholders’ equity | $ | 1,324,417 | $ | 1,768,273 |
PEGASYSTEMS INC. UNAUDITED CONDENSED CONSOLIDATED STATEMENTS OF CASH FLOWS (in thousands) | |||||||
Six Months Ended June 30, | |||||||
2025 | 2024 | ||||||
Net income (loss) | $ | 115,499 | $ | (5,511 | ) | ||
Adjustments to reconcile net income (loss) to cash provided by operating activities | |||||||
Non-cash items | 123,170 | 116,288 | |||||
Change in operating assets and liabilities, net | 51,827 | 109,466 | |||||
Cash provided by operating activities | 290,496 | 220,243 | |||||
Cash provided by (used in) investing activities | 212,995 | (209,700 | ) | ||||
Cash (used in) provided by financing activities | (646,316 | ) | 22,503 | ||||
Effect of exchange rate changes on cash, cash equivalents, and restricted cash | 7,407 | (2,842 | ) | ||||
Net (decrease) increase in cash, cash equivalents, and restricted cash | (135,418 | ) | 30,204 | ||||
Cash, cash equivalents, and restricted cash, beginning of period | 341,529 | 232,827 | |||||
Cash, cash equivalents, and restricted cash, end of period | $ | 206,111 | $ | 263,031 |
PEGASYSTEMS INC. RECONCILIATION OF SELECTED GAAP AND NON-GAAP MEASURES (1) (in thousands, except percentages and per share amounts) | |||||||||||||||||||||
Three Months Ended June 30, | Six Months Ended June 30, | ||||||||||||||||||||
2025 | 2024 | Change | 2025 | 2024 | Change | ||||||||||||||||
Net income (loss) - GAAP | $ | 30,077 | $ | 6,613 | 355 | % | $ | 115,499 | $ | (5,511 | ) | * | |||||||||
Stock-based compensation (2) | 36,730 | 36,224 | 78,155 | 71,005 | |||||||||||||||||
Restructuring | (44 | ) | 635 | (33 | ) | 798 | |||||||||||||||
Legal fees | 6,409 | 2,409 | 12,953 | 4,351 | |||||||||||||||||
Litigation settlement, net of recoveries | — | — | — | 32,403 | |||||||||||||||||
Amortization of intangible assets | 675 | 789 | 1,376 | 1,753 | |||||||||||||||||
Interest on convertible senior notes | — | 619 | 394 | 1,236 | |||||||||||||||||
Capped call transactions | — | 3,277 | 223 | (22 | ) | ||||||||||||||||
Foreign currency transaction loss (gain) | 14,008 | (437 | ) | 19,333 | 2,825 | ||||||||||||||||
Other | (18,729 | ) | — | (19,480 | ) | (1,628 | ) | ||||||||||||||
Income taxes (3) | (18,975 | ) | (4,288 | ) | (17,727 | ) | (19,215 | ) | |||||||||||||
Net income - non-GAAP | $ | 50,151 | $ | 45,841 | 9 | % | $ | 190,693 | $ | 87,995 | 117 | % | |||||||||
Diluted earnings (loss) per share - GAAP | $ | 0.17 | $ | 0.04 | 325 | % | $ | 0.63 | $ | (0.03 | ) | * | |||||||||
non-GAAP adjustments | 0.11 | 0.22 | 0.41 | 0.53 | |||||||||||||||||
Diluted earnings per share - non-GAAP | $ | 0.28 | $ | 0.26 | 8 | % | $ | 1.04 | $ | 0.50 | 108 | % | |||||||||
Diluted weighted-average number of common shares outstanding - GAAP | 182,160 | 177,000 | 3 | % | 185,477 | 169,424 | 9 | % | |||||||||||||
Capped call transactions | — | — | (2,412 | ) | — | ||||||||||||||||
Stock-based compensation | — | — | — | 6,436 | |||||||||||||||||
Diluted weighted-average number of common shares outstanding - non-GAAP | 182,160 | 177,000 | 3 | % | 183,065 | 175,860 | 4 | % | |||||||||||||
* Not meaningful |
Our non-GAAP financial measures reflect the following adjustments:
(1) | Per share amounts have been recast for all prior periods to reflect the effect of the Company’s two-for-one forward common stock split effected in the form of a stock dividend distributed on June 20, 2025. | |
(2) | Stock-based compensation: |
Three Months Ended June 30, | Six Months Ended June 30, | ||||||||||||||
(Dollars in thousands) | 2025 | 2024 | 2025 | 2024 | |||||||||||
Cost of revenue | $ | 7,288 | $ | 7,092 | $ | 15,111 | $ | 13,664 | |||||||
Selling and marketing | 14,378 | 13,564 | 30,159 | 27,452 | |||||||||||
Research and development | 7,490 | 7,825 | 15,875 | 15,471 | |||||||||||
General and administrative | 7,574 | 7,743 | 17,010 | 14,418 | |||||||||||
$ | 36,730 | $ | 36,224 | $ | 78,155 | $ | 71,005 | ||||||||
Income tax benefit | $ | (566 | ) | $ | (554 | ) | $ | (1,153 | ) | $ | (865 | ) |
(3) | Effective income tax rates: |
Six Months Ended June 30, | |||||
2025 | 2024 | ||||
GAAP | 24 | % | * | ||
non-GAAP | 22 | % | 22 | % | |
* Not meaningful |
Our GAAP effective income tax rate is subject to significant fluctuations due to several factors, including our stock-based compensation plans, research and development tax credits, and the valuation allowance on our deferred tax assets in the U.S. and U.K. We determine our non-GAAP income tax rate using applicable rates in taxing jurisdictions and assessing certain factors, including historical and forecasted earnings by jurisdiction, discrete items, and ability to realize tax assets. We believe it is beneficial for our management to review our non-GAAP results consistent with our annual plan’s effective income tax rate as established at the beginning of each year, given tax rate volatility.
PEGASYSTEMS INC. RECONCILIATION OF FREE CASH FLOW (1) AND OTHER METRICS (in thousands, except percentages) | ||||||||||
Six Months Ended June 30, | Change | |||||||||
2025 | 2024 | |||||||||
Cash provided by operating activities | $ | 290,496 | 220,243 | 32 | % | |||||
Investment in property and equipment | (4,015 | ) | (1,857 | ) | ||||||
Free cash flow (1) | $ | 286,481 | $ | 218,386 | 31 | % | ||||
Supplemental information (2) | ||||||||||
Litigation settlement, net of recoveries | $ | — | $ | 32,403 | ||||||
Legal fees | 10,020 | 2,701 | ||||||||
Restructuring | 1,354 | 3,852 | ||||||||
Interest paid on convertible senior notes | 1,754 | 1,884 | ||||||||
Income taxes, net of refunds | (702 | ) | 25,560 | |||||||
$ | 12,426 | $ | 66,400 |
(1) Our non-GAAP free cash flow is defined as cash provided by operating activities less investment in property and equipment. Investment in property and equipment fluctuates in amount and frequency and is significantly affected by the timing and size of investments in our facilities and equipment. We provide information on free cash flow to enable investors to assess our ability to generate cash without incurring additional external financings. This information is not a substitute for financial measures prepared under U.S. GAAP.
(2) The supplemental information discloses items that affect our cash flows and are considered by management not to be representative of our core business operations and ongoing operational performance.
PEGASYSTEMS INC.
ANNUAL CONTRACT VALUE
(in thousands, except percentages)
Annual contract value (“ACV”) - ACV represents the annualized value of our active contracts as of the measurement date. The contract's total value is divided by its duration in years to calculate ACV. ACV is a performance measure that we believe provides useful information to our management and investors.
June 30, 2025 | June 30, 2024 | Change | Constant Currency Change | |||||||||||
Pega Cloud | $ | 761,051 | $ | 593,752 | $ | 167,299 | 28 | % | 25 | % | ||||
Maintenance | 301,375 | 310,608 | (9,233 | ) | (3 | )% | (5 | )% | ||||||
Subscription services | 1,062,426 | 904,360 | 158,066 | 17 | % | 15 | % | |||||||
Subscription license | 451,591 | 400,949 | 50,642 | 13 | % | 11 | % | |||||||
$ | 1,514,017 | $ | 1,305,309 | $ | 208,708 | 16 | % | 14 | % |
PEGASYSTEMS INC.
BACKLOG
(in thousands, except percentages)
Remaining performance obligations (“Backlog”) - Expected future revenue from existing non-cancellable contracts:
As of June 30, 2025:
Subscription services | Subscription license | Perpetual license | |||||||||||||||||||||||
Pega Cloud | Maintenance | Consulting | Total | ||||||||||||||||||||||
1 year or less | $ | 603,683 | $ | 220,954 | $ | 61,905 | $ | 317 | $ | 39,798 | $ | 926,657 | 51 | % | |||||||||||
1-2 years | 334,586 | 79,345 | 4,262 | — | 2,846 | 421,039 | 23 | % | |||||||||||||||||
2-3 years | 172,513 | 49,587 | 746 | — | 252 | 223,098 | 12 | % | |||||||||||||||||
Greater than 3 years | 210,416 | 46,843 | 7,220 | — | 56 | 264,535 | 14 | % | |||||||||||||||||
$ | 1,321,198 | $ | 396,729 | $ | 74,133 | $ | 317 | $ | 42,952 | $ | 1,835,329 | 100 | % | ||||||||||||
% of Total | 72 | % | 22 | % | 4 | % | — | % | 2 | % | 100 | % | |||||||||||||
Change since June 30, 2024 | |||||||||||||||||||||||||
$ | 306,436 | $ | 75,823 | $ | 37,143 | $ | (2,379 | ) | $ | 12,057 | $ | 429,080 | |||||||||||||
30 | % | 24 | % | 100 | % | (88 | )% | 39 | % | 31 | % |
As of June 30, 2024:
Subscription services | Subscription license | Perpetual license | |||||||||||||||||||||||
Pega Cloud | Maintenance | Consulting | Total | ||||||||||||||||||||||
1 year or less | $ | 470,379 | $ | 209,655 | $ | 23,931 | $ | 2,696 | $ | 25,953 | $ | 732,614 | 52 | % | |||||||||||
1-2 years | 301,070 | 63,266 | 10,078 | — | 2,469 | 376,883 | 27 | % | |||||||||||||||||
2-3 years | 152,839 | 30,032 | 2,884 | — | 2,473 | 188,228 | 13 | % | |||||||||||||||||
Greater than 3 years | 90,474 | 17,953 | 97 | — | — | 108,524 | 8 | % | |||||||||||||||||
$ | 1,014,762 | $ | 320,906 | $ | 36,990 | $ | 2,696 | $ | 30,895 | $ | 1,406,249 | 100 | % | ||||||||||||
% of Total | 72 | % | 23 | % | 3 | % | — | % | 2 | % | 100 | % |
PEGASYSTEMS INC. RECONCILIATION OF GAAP BACKLOG AND CONSTANT CURRENCY BACKLOG (in millions, except percentages) | |||||||||
June 30, 2024 | June 30, 2025 | 1 Year Growth Rate | |||||||
Backlog - GAAP | $ | 1,406 | $ | 1,835 | 31 | % | |||
Impact of changes in foreign exchange rates | — | (55 | ) | ||||||
Constant currency backlog | $ | 1,406 | $ | 1,780 | 27 | % | |||
Note: Constant currency backlog is calculated by applying the June 30, 2024 foreign exchange rates to current period shown. |
View source version on businesswire.com: https://www.businesswire.com/news/home/20250722695089/en/
ECB
Analyser
Rapportperioden
Kryptovalutor
ECB
Analyser
Rapportperioden
Kryptovalutor
1 DAG %
Senast


Börsen idag
Igår, 17:47
Positivt på Stockholmsbörsen – Astra Zeneca lyfter efter positiva studieresultat
Integrum
Igår, 14:50
Budet på Integrum: Rekordhög premie
OMX Stockholm 30
1 DAG %
Senast
2 600,22


-992x558.webp&w=3840&q=75)


-992x558.webp&w=3840&q=75)


